
Underwriting & Risk Management | Bond Capital
EBITDA Normalization in Credit Underwriting: A Practitioner’s Framework for Stripping Adjusted Earnings Down to Defensible Cash
The Underwriting Challenge: Whose EBITDA Are You Actually Lending Against?
A sponsor presents a $10M EBITDA manufacturing business. The Confidential Information Memorandum shows clean revenue growth, stable margins, and a compelling adjusted EBITDA bridge. Debt capacity looks adequate at 4.5x. You move to term sheet.
Then your credit team opens the quality of earnings report and finds $2.4M in add-backs: a “one-time” restructuring charge that recurred three years running, owner compensation normalized to a replacement CEO who has never been hired, and a pro forma synergy from a bolt-on acquisition that has yet to close. Suddenly, a 4.5x deal is really 6.2x—and the DSCR that looked like 1.8x collapses to 1.1x.
This is not a hypothetical. It is the central underwriting problem of the current credit cycle. Expanded EBITDA definitions, aggressive add-back schedules, and run-rate projections have become a structural feature of private credit documentation. Understanding how to stress-test, haircut, and independently reconstruct EBITDA is now a core competency for any credit officer, not a QoE formality.
This article presents Bond Capital’s practitioner framework for EBITDA normalization in credit underwriting: how to build a lender-adjusted EBITDA bridge from scratch, which add-backs to accept or reject, and how the resulting number flows directly into leverage, coverage, and covenant structure.
The Analytical Framework: From Reported to Lender-Adjusted EBITDA
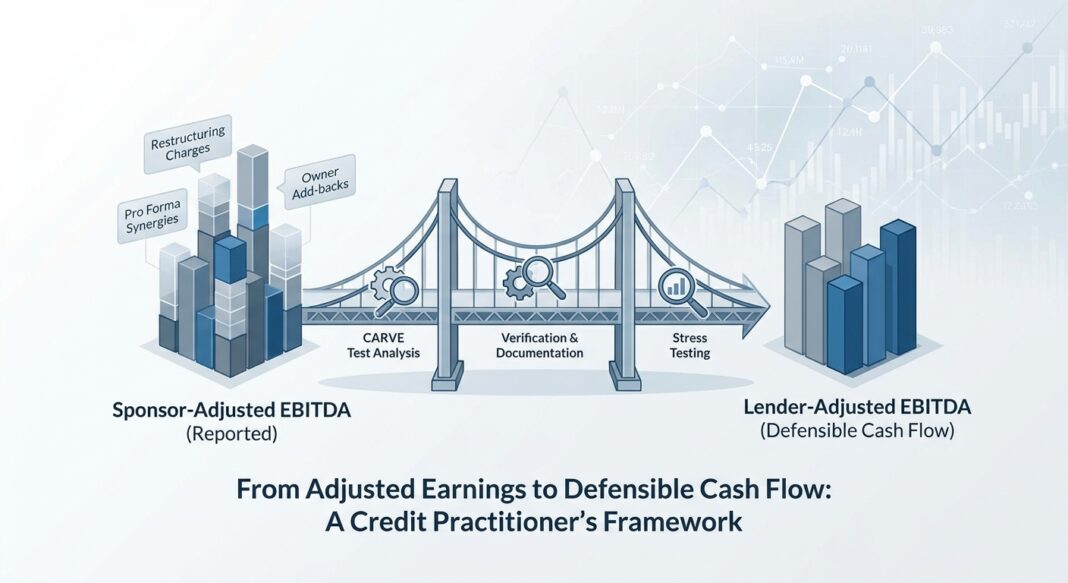
The first principle of credit underwriting is that seller-provided EBITDA is a starting point, not a conclusion. Lenders must independently evaluate every adjustment, document their reasoning in the credit file, and arrive at their own defensible earnings base. The best credit memos show both the borrower-adjusted EBITDA and the lender-adjusted EBITDA, with a clear bridge between them—preserving transparency for approvers, portfolio managers, and future renewal teams.
Step 1 — Anchor to Reported Financials
Start with GAAP-basis consolidated net income from audited or reviewed statements. Build up through interest, taxes, depreciation, and amortization to reach reported EBITDA. This anchors the analysis in documented financial history, not management presentation.
Step 2 — Apply the CARVE Test to Every Add-Back
Bond Capital applies a five-factor decision framework before accepting any add-back:
- C — Corroborated: Is the expense supported by third-party documentation (invoices, court filings, payroll records)?
- A — Anomalous: Is this item genuinely outside the normal course of business, or does it recur annually under different labels?
- R — Revenue-Excluded: Does removing this expense impair the business’s ability to generate revenue, serve customers, or meet compliance obligations? If yes, it stays in.
- V — Verifiable Timeline: Is there a clear end date, or is this an ongoing cost being mislabeled as non-recurring?
- E — Economics-Linked: Does this add-back improve reported earnings without improving cash generation? Add-backs that inflate EBITDA but do not fund debt service are underwriting fiction.
An add-back that fails two or more CARVE factors should be haircut by 50% or excluded entirely. Document the reason in the credit memo.
Step 3 — Reconcile to Key Ratios Using the Same Earnings Base
Once a lender-adjusted EBITDA is established, it must be used consistently across all ratio calculations: Total Debt / EBITDA, DSCR (EBITDA − CapEx − Taxes / Total Debt Service), and any financial covenant definitions. Mixing borrower-adjusted EBITDA with lender-calculated leverage creates a false picture of credit quality.
Walking the Calculation: A $10M EBITDA Manufacturing Borrower
Consider a mid-market industrial manufacturer with the following presentation:
| Adjustment Item | Sponsor Amount | Lender Decision | Lender Credit | Rationale |
|---|---|---|---|---|
| Reported EBITDA (GAAP) | $7,600,000 | Accept | $7,600,000 | Tied to audited trial balance |
| Owner compensation excess | +$900,000 | Haircut 50% | +$450,000 | Replacement CEO not yet identified; market comp at $450K per Robert Half 2025 Guide, partial credit only |
| Related-party rent normalization | +$300,000 | Accept | +$300,000 | CoStar comparable documented; lease to owner LLC above market by $300K |
| One-time legal settlement | +$420,000 | Accept with caveat | +$420,000 | Wrongful termination, settled with prejudice; confirmed non-recurring |
| Restructuring charges | +$380,000 | Reject | $0 | Third consecutive year of “restructuring” charges; treated as ongoing operating cost |
| Pro forma acquisition synergies | +$600,000 | Reject | $0 | Bolt-on not closed; no demonstrated operating history at synergy level |
| Non-recurring customer windfall (reverse) | $0 | Subtract | −$250,000 | One-time government contract in TTM; not renewable; lender removes from run-rate |
| Sponsor-Adjusted EBITDA | $10,200,000 | — | — | — |
| Lender-Adjusted EBITDA | — | — | $8,520,000 | $1,680,000 delta from sponsor presentation |
Ratio Impact: How the Bridge Changes the Credit Decision
Assume $40M of total debt and $4.2M of annual debt service (P&I):
| Metric | Sponsor EBITDA ($10.2M) | Lender EBITDA ($8.52M) |
|---|---|---|
| Total Leverage (Debt/EBITDA) | 3.9x | 4.7x |
| DSCR (EBITDA / Debt Service) | 2.43x | 2.03x |
| Stress DSCR (−20% EBITDA) | 1.94x | 1.62x |
| Stress DSCR (−30% EBITDA) | 1.70x | 1.42x — Near policy floor |
A $1.68M difference in adjusted EBITDA moves this credit from a straightforward approval to a conditional approval requiring additional covenant protection, an equity cure mechanism, or a reduced hold position. This is precisely why the evidence standard must match the impact of each add-back on the final credit decision.
Industry Standards, Red Flags, and Credit Performance Data
What Institutional Lenders Are Watching in 2026
The structural risks embedded in current EBITDA documentation practices are not theoretical. According to McKinsey’s 2025 Global Private Markets Report, leverage ratios on new private credit transactions averaged 4.9x EBITDA in 2025, with covenant-lite structures rising to 21% of direct lending deals—up sharply from just 4% in 2023. Meanwhile, Proskauer’s 15th Annual Private Credit Insights Report, covering over 450 transactions representing $124 billion in value, found that 81% of deals in 2025 provided borrowers with incremental “free-and-clear” debt baskets exceeding 100% of EBITDA, up from 64% in 2024.
The cumulative effect is well-documented: inflated EBITDA definitions, combined with permissive add-back caps, leave leverage tests far less exacting than headline ratios suggest. Leverage-linked maintenance tests now frequently include cushions allowing borrower EBITDA to fall 30–40% before triggering a breach. For a lender who has already haircut EBITDA conservatively, this cushion can compress quickly under real operating stress.
Experienced credit officers at institutional direct lenders apply two additional safeguards that operate independently from covenant EBITDA: liquidity tests (minimum unrestricted cash or revolver availability) and cash dominion triggers that activate at defined performance thresholds. As one practitioner framework notes, borrowers can inflate adjusted EBITDA, but they cannot print cash.
Default Rate Context: Why This Discipline Matters Now
📊 Credit Performance Benchmark Data
- Private Credit Default Rate (2025): Moody’s estimates the private credit default rate ranged between 1.6% and 4.7% in 2025, depending on whether distressed exchanges are included. Distressed restructurings accounted for approximately 65% of all corporate defaults in 2025. (Source: Moody’s, 2026)
- Record Default Rate (April 2026): Fitch Ratings reported that the U.S. private credit default rate hit a record 6.0% in April 2026, with private-credit-backed borrowers experiencing a 9.2% default rate across full-year 2025. (Source: Fitch Ratings, via Forbes, May 2026)
- S&P High-Yield Default Rate: S&P reported a trailing 12-month high-yield speculative-grade default rate above 4% through September 2025, with a forecast decline to 4.0% by September 2026. (Source: S&P Global / Valuation Research, 2026)
- Leveraged Loan Default Rate (June 2026): The U.S. trailing 12-month leveraged loan default rate stood at 1.34% as of June 2026, with defaults expected to continue declining through the year. (Source: Invesco, Q2 2026)
- First-Lien Recovery Rates: First-lien senior secured loans have historically recovered 70–80 cents on the dollar on an ultimate recovery basis. Recent expected recoveries have drifted toward 60–70% as modern capital structures carry more senior debt and fewer junior cushions. (Source: LSEG Yield Book / CLO Recovery Rate Data, 2025–2026)
- Post-Restructuring Default Risk: Moody’s analysis of 1,173 borrowers that experienced distressed restructurings found that more than 70% of eventual hard defaults following a soft credit event occurred within the first two years. (Source: Moody’s Default & Recovery Database, 2026)
Common Red Flags in Seller EBITDA Packages
- Recurring “non-recurring” charges: Restructuring, integration, or advisory fees that appear in multiple LTM periods under different descriptions.
- Pro forma synergies without demonstrated history: Run-rate adjustments annualizing recent quarters should only be accepted when at least two quarters of demonstrated performance exist at the new earnings level.
- Owner compensation normalized to an unfilled role: If no replacement hire has been made or quoted, credit only 50% of the add-back or tie the full credit to a closing condition.
- EBITDA that exceeds cash generation by >15%: When adjusted EBITDA consistently exceeds operating cash flow by a wide margin, the gap is likely explained by working capital consumption, maintenance CapEx disguised as growth spend, or aggressive accrual accounting.
- Aggressive run-rate on contracted revenue not yet earned: A contract signing is not revenue recognition. Lenders should require proof of collections, not bookings.
Bond Capital EBITDA Underwriting Checklist
Use the following diligence framework when reviewing any adjusted EBITDA package in a credit submission:
-
✅ Anchor to Audited Financials
Obtain the last three years of audited or CPA-reviewed financial statements. Build reported EBITDA from GAAP net income up. Never start from management’s adjusted schedule. -
✅ Request Full Add-Back Schedule with Documentation
Demand line-item support for every add-back: invoices, court orders, W-2s, market compensation surveys, broker rent comps. Undocumented adjustments are rejected. -
✅ Apply CARVE Test to Each Item
Score every add-back against the five CARVE factors. Items failing two or more criteria are haircut 50% or excluded. Document the score in the credit memo. -
✅ Build the Lender-Adjusted Bridge
Produce a written reconciliation from reported EBITDA → borrower-adjusted EBITDA → lender-adjusted EBITDA. Present the delta and explain every divergence from the sponsor’s schedule. -
✅ Recalculate All Ratios from Lender EBITDA
Recalculate Debt/EBITDA, DSCR, Fixed Charge Coverage, and any covenant tests using only the lender-adjusted number. Flag any ratio that changes by more than 0.5x from the sponsor presentation. -
✅ Stress Test −20% and −30% EBITDA Scenarios
Run downside scenarios against lender-adjusted EBITDA. If DSCR falls below 1.20x under a −20% stress, require structural protections: equity cure, cash sweep, or reduced leverage. -
✅ Review LTM vs. TTM Cash Flow Conversion
Compare adjusted EBITDA to actual operating cash flow from the cash flow statement. A consistent gap >15% is a red flag requiring explanation. Ask for the working capital schedule. -
✅ Verify Owner-Dependent Revenue
If a material percentage of revenue is tied to owner relationships, require customer concentration disclosure, customer interview rights, and a key-person covenant. -
✅ Confirm Covenant EBITDA Definition Matches Underwriting EBITDA
Review the credit agreement’s definition of Consolidated EBITDA carefully. Ensure add-back caps are in place for projection-based or synergy items. Loose definitions create covenant holes that persist for the life of the loan. -
✅ Document Everything in the Credit File
The credit file should contain the original borrower add-back schedule, the lender’s CARVE scoring worksheet, the lender-adjusted bridge, and the revised ratio table. This protects the institution in portfolio review, regulatory examination, and any future workout.
Key Takeaways for Credit Underwriters
- The add-back gap is the leverage gap. A $1.68M difference in adjusted EBITDA on a $40M facility can swing total leverage by nearly a full turn and collapse DSCR to near-policy minimums. Every dollar of add-back requires an equivalent dollar of documentation.
- Recurring “non-recurring” items are the most common form of earnings inflation. Restructuring, integration, and advisory charges that appear in multiple periods are operating costs. Accepting them as one-time items is an underwriting error, not a documentation preference.
- Pro forma synergies without demonstrated history are speculation. Run-rate adjustments should only receive full credit when at least two quarters of confirmed performance exist at the new earnings level. Anything less should be haircut or conditioned at closing.
- Default rates are elevated and distressed restructurings dominate the loss cycle. With Moody’s estimating that 65% of 2025 corporate defaults were distressed exchanges, lenders who extended permissive EBITDA definitions in documentation are finding that covenant tests fail to trigger early warning signals in time to protect recovery. Tight definitions and independent underwriting EBITDA remain the first line of defense.
- Lender-adjusted EBITDA must control the covenant definition. The credit agreement’s Consolidated EBITDA definition should cap projection-based add-backs as a percentage of EBITDA, require time-based restrictions on synergy credits, and preserve the lender’s right to challenge compliance calculations. Loose definitions are structural risk that compounds over the loan’s life.


