
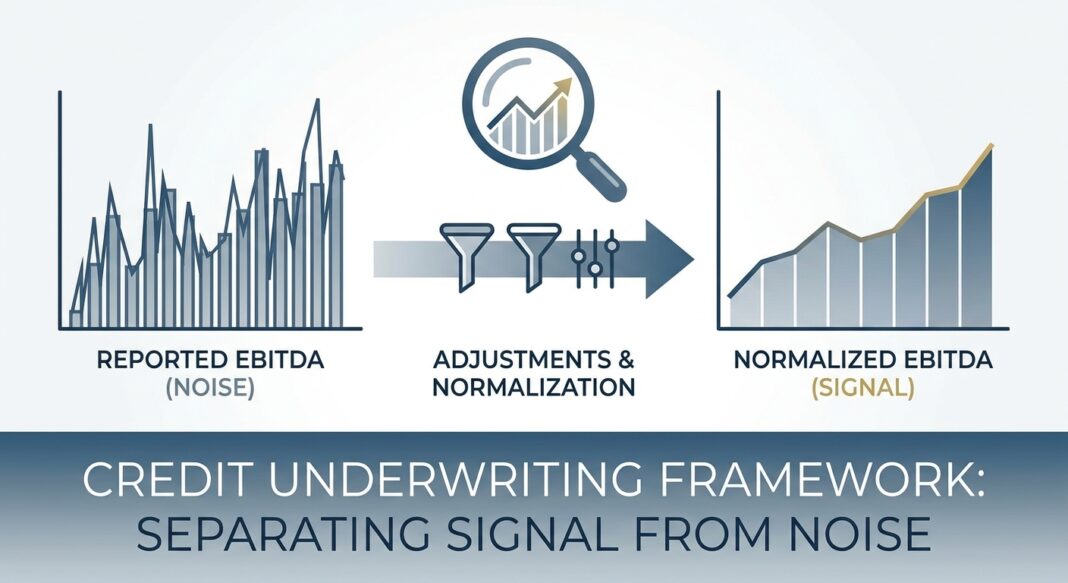
When a sponsor presents $12M in adjusted EBITDA on a $10M reported base, the lender’s job isn’t to accept that bridge — it’s to rebuild it from scratch.
The Underwriting Problem at the Center of Every Credit Decision
Consider a common scenario at the front end of a middle-market credit: a sponsor submits a CIM showing a manufacturing business with $10M in reported EBITDA and $12.5M in adjusted EBITDA — a 25% uplift driven by eight separate add-back items. The deal is structured at 4.8x adjusted leverage. At first glance, that clears most institutional underwriting thresholds. But what if three of those eight add-backs are legally questionable, two are recurring costs dressed as one-time items, and one is a forward-looking synergy that hasn’t been captured yet?
Suddenly 4.8x leverage is actually 6.2x. Debt service coverage collapses. The credit memo gets rewritten.
EBITDA normalization is simultaneously the most consequential and the most contested step in credit underwriting. It sets the denominator for leverage tests, the baseline for DSCR calculations, and the compliance threshold for maintenance covenants — all in a single non-GAAP figure that the borrower controls the first draft of. Institutional lenders understand that seller-provided schedules are a starting point, not a conclusion. The underwriter’s task is to reconstruct EBITDA independently, document every decision, and arrive at a defensible number that reflects the business’s true, repeatable earnings power under a new owner.
This article provides a practitioner-level framework for doing exactly that.
The Analytical Framework: Four-Layer EBITDA Reconstruction
Lender-adjusted EBITDA is not a single calculation — it is a four-layer process that moves from raw financials to a defensible, auditable earnings base. Each layer requires independent verification, not reliance on management’s representations.
Layer 1 — Reported EBITDA (GAAP Baseline)
Begin with the audited income statement. Compute EBITDA mechanically: Net Income + Interest Expense + Income Taxes + Depreciation + Amortization. This is the only figure in the entire normalization process that is independently verified by an outside auditor. Every subsequent adjustment moves away from that anchor — which is exactly why each one demands documentary support.
For our example company — a $10M EBITDA specialty manufacturer — reported EBITDA is confirmed at $10.0M from audited financials for the trailing twelve months (TTM) ending September 30, 2026.
Layer 2 — Non-Recurring Add-Backs (One-Time Items)
These are the most widely accepted adjustments when properly documented. Common categories include restructuring charges, litigation settlements, acquisition transaction costs, and one-time asset write-offs. The critical test: each proposed add-back must tie directly to source documents — invoices, settlement agreements, board minutes, or bank statements. As one credit practitioner’s framework notes, each adjustment should tie to financial statements, tax returns, bank statements, payroll records, invoices, board minutes, purchase agreements, or general ledger detail. An add-back that exists only in management’s Excel schedule is not an add-back; it is an assertion.
Example application: The sponsor adds back $750,000 in legal fees from a resolved trade dispute and $400,000 in severance from a plant restructuring completed in Q1 2026. Both are supported by settlement documentation and payroll records. Lender accepts both: +$1.15M.
Layer 3 — Owner/Related-Party Normalization
For founder-owned or family-controlled businesses, compensation normalization is often the largest single adjustment. The approach requires identifying each owner’s operating role, estimating a market-rate replacement cost for that function, and documenting the basis for that assumption. The lender should replace above-market owner compensation with a market-rate salary assumption — not simply add back the entire payment. Related-party rent requires the same discipline: above-market rent gets normalized down; below-market rent (which a buyer will face at market) gets normalized up.
Example application: The owner pays himself $1.2M annually. Market-rate COO compensation for a company of this size is $350,000. Lender-adjusted add-back: $850,000. The owner also leases the facility to the business at $180,000/year; independent appraisal indicates market rent of $240,000/year. Lender reduces EBITDA by $60,000. Net Layer 3 impact: +$790,000.
Layer 4 — Pro Forma and Run-Rate Adjustments (Most Scrutinized)
These adjustments — which include uncaptured synergies, annualized revenue from new contracts, and cost savings from recent initiatives — carry the highest analytical risk. Sellers frequently include forward-looking items as if they have already occurred, a practice that normalization adjustments eliminate distortions in reported historical results but that pro forma adjustments must be subjected to a higher evidentiary standard. A lender should only include run-rate adjustments that are (a) contractually committed, (b) partially realized and measurable, and (c) not dependent on future management execution. Speculative synergies belong in a forecast or sensitivity case, not in the covenant EBITDA base.
Example application: Sponsor claims $1.5M in run-rate savings from a procurement initiative. Lender review finds only $600,000 has been realized in the TTM period, with supporting vendor contract amendments. Lender haircuts the add-back to $600,000: +$600,000.
The Lender-Adjusted EBITDA Bridge (Example Company)
| Line Item | Amount | Disposition |
|---|---|---|
| Reported EBITDA (Audited TTM) | $10,000,000 | Anchor — accepted |
| Legal settlement (documented) | +$750,000 | Accepted — invoice + bank payment on file |
| Severance charges (resolved) | +$400,000 | Accepted — payroll records reviewed |
| Owner compensation normalization | +$850,000 | Accepted — market comp survey documented |
| Related-party rent (below market) | -$60,000 | Reduction — appraisal supports market rate |
| Procurement run-rate savings | +$600,000 | Haircutted from $1.5M — partial realization only |
| Inventory obsolescence write-off | +$200,000 | Accepted — COGS footnote confirmed |
| Sponsor add-back: forward synergies | $0 | Rejected — no contractual commitment, no realization |
| Lender-Adjusted EBITDA | $12,740,000 | vs. sponsor’s $13,450,000 claim |
The $710,000 gap between lender and sponsor EBITDA represents a 0.4x swing in leverage at 4.8x total debt — moving a borderline approval to a clear acceptance, or vice versa.
Translating Lender EBITDA Into Credit Metrics: The Calculation Chain
Once lender-adjusted EBITDA is established, it becomes the denominator (or numerator) in every core credit metric. Crucially, the same EBITDA figure must flow consistently through leverage, coverage, and covenant calculations — not recalculated selectively. As one credit analysis framework articulates, DSCR, leverage, and covenants must use the same lender-adjusted EBITDA base.
Leverage (Debt / EBITDA)
With $61.2M in total debt and $12.74M in lender-adjusted EBITDA: Total Leverage = 4.8x. This compares to the current middle market standard of 4.0x–5.0x total debt for leveraged buyouts, with the lower end applied to smaller or more cyclical businesses. The FSB has flagged that the growing use of EBITDA adjustments in private credit means headline leverage may be materially understated — with true economic leverage in some transactions potentially closer to 7x when aggressive add-backs are stripped out.
Debt Service Coverage Ratio (DSCR)
DSCR = Lender-Adjusted EBITDA ÷ (Cash Interest + Scheduled Principal). Using $12.74M EBITDA, $4.2M annual cash interest (at SOFR + 550 bps on floating debt), and $2.0M scheduled amortization: DSCR = $12.74M ÷ $6.2M = 2.06x. Institutional lenders in the middle market typically require a minimum DSCR of 1.20x at covenant levels, with underwriting comfort emerging above 1.50x. A 2.06x entry-level DSCR provides meaningful headroom but requires stress-testing against rate increases, revenue softness, and margin compression.
Stress Testing the EBITDA Base
A 20% EBITDA stress (revenue decline or margin compression) reduces lender-adjusted EBITDA to $10.2M. Restated DSCR: $10.2M ÷ $6.2M = 1.65x — still compliant, but the cushion narrows. A 30% stress — consistent with a moderate cyclical contraction — brings DSCR to 1.36x, approaching typical maintenance covenant triggers. This stress-testing exercise is not hypothetical theater; it defines where covenant headroom disappears and what conditions require lender intervention.
What Institutional Lenders Look For — And What Gets Deals Killed
Experienced credit committees have seen every variant of EBITDA inflation. The patterns that generate the most friction — and the most value destruction — fall into predictable categories.
Red Flags in Add-Back Schedules
- Recurring “one-time” charges: If restructuring costs, system implementation charges, or professional fees appear in three consecutive years, they are a cost of doing business — not a normalization item. A lender should trend each proposed add-back category across 3–5 years of financials before accepting its non-recurring characterization.
- Management-only schedules: Add-backs that appear solely in a management Excel file and cannot be traced to audited financials, tax returns, or third-party invoices should be rejected outright, regardless of how reasonable they sound. Documentation is not a formality — it is the control.
- Large run-rate synergy claims: Synergy add-backs tied to future cost initiatives, cross-selling opportunities, or headcount actions that haven’t commenced are forward-looking projections presented as historical normalization. These belong in a sensitivity case, not in the covenant base.
- EBITDA definition drift in credit agreements: Covenant EBITDA can diverge significantly from operating EBITDA through negotiated adjustments. When drafting is loose, covenant holes persist for the loan’s entire life — creating a situation where a borrower can be technically covenant-compliant while generating negative free cash flow.
- Inflated pro forma revenue: Run-rate revenue adjustments for partially onboarded customers require contract documentation, billing evidence, and collections history — not just a management representation that the customer is “ramping.”
Credit Performance Data: Why This Matters in Aggregate
📊 Data Box: Credit Performance Benchmarks (2024–2026)
- Private Credit Default Rate (2025): Moody’s estimates the private credit direct lending default rate in 2025 likely ranged between 1.6% and 4.7%, depending on whether distressed exchanges are included — a wide band reflecting the opacity of the asset class and the growing role of soft credit events.
- Distressed Restructurings as % of Defaults: Moody’s Ratings reported that distressed exchanges accounted for 64% of all defaults in the first half of 2025, about the same pace as all of 2024 — meaning most “defaults” in private credit are quiet covenant modifications, not formal bankruptcies.
- Post-Restructuring Default Risk: More than 70% of eventual hard defaults following a distressed restructuring occur within the first two years of the initial soft credit event — meaning borrowers that restructured in 2023–2024 are entering their most vulnerable window now.
- First-Lien Recovery Rates: Moody’s long-term data shows 1st lien bank loans recovering approximately 65% on a trading-price basis (1983–2023), with expected ultimate recoveries estimated at approximately 68% on a forward basis — below the long-run high-70s historical average, driven by higher indebtedness, fewer junior cushions, and weaker covenant protections in modern structures.
- Covenant-Lite Recovery Penalty: Moody’s has estimated a recovery of approximately 50% for first-lien-only structures that are covenant-lite, versus 65% when a first-lien structure includes maintenance covenants — a 15-point recovery penalty for lending without financial maintenance tests.
- Average Leverage on New Issuance: Private credit new-issue leverage averaged 4.9x EBITDA in 2025 (per Kroll StepStone data), compared with 5.0x in 2024 and 5.2x in 2023 — showing modest compression but remaining elevated relative to leveraged loan market standards.
The takeaway from this data is structural: aggressive EBITDA normalization compresses apparent leverage, reduces the junior equity cushion that protects lenders, and — when combined with looser covenant structures — materially weakens recovery outcomes if a borrower hits distress. A credit officer who accepts a 20% EBITDA uplift without rigorous documentation is not just approving a higher-risk loan; they are potentially understating loss severity by a full lien position’s worth of capital.
The EBITDA Normalization Diligence Checklist
The following checklist represents minimum institutional-quality diligence standards for EBITDA normalization. It should be completed by the underwriting analyst, reviewed by the credit officer, and documented in the credit file before any leverage or coverage ratios are presented to credit committee.
Documentation & Source Verification
- ☐ Obtain audited financial statements for a minimum of 3 fiscal years plus TTM
- ☐ Obtain business tax returns for the same period and reconcile to GAAP financials
- ☐ Pull general ledger detail for every proposed add-back category
- ☐ Require invoices, settlement documents, or contracts for all non-recurring charges >$50,000
- ☐ Verify bank statement support for material cash outflows proposed as add-backs
- ☐ Review board minutes for any extraordinary or unusual charge discussions
Add-Back Validation
- ☐ Trend each proposed add-back category across all available historical periods
- ☐ Apply the recurrence test: has this category appeared more than once in 3 years? If yes, treat as recurring
- ☐ Apply the necessity test: is this cost required to serve customers, meet compliance, or maintain the asset base? If yes, it stays in EBITDA
- ☐ For owner comp normalization, obtain a market compensation survey and document the replacement-cost basis
- ☐ For related-party rent, obtain an independent market-rate lease appraisal or broker quote
- ☐ For run-rate adjustments, require signed contracts, billing records, and at least partial realization in the TTM
- ☐ Reject all forward synergies, uncontracted revenue ramps, and projected cost savings
Bridge Construction & Ratio Consistency
- ☐ Build a formal EBITDA bridge from reported (GAAP) to lender-adjusted, with every line item categorized and footnoted
- ☐ Present both borrower-adjusted EBITDA and lender-adjusted EBITDA in the credit memo, with a clear reconciliation
- ☐ Confirm that leverage, DSCR, and all covenant calculations use the identical lender-adjusted EBITDA figure
- ☐ Stress-test lender EBITDA at –20% and –30% scenarios; document covenant breach points
- ☐ Review EBITDA definition in the draft credit agreement; flag any add-back language that diverges from underwriting assumptions
Questions to Ask Management & Sponsors
- ☐ "Can you walk us through each add-back line-by-line with source documentation?"
- ☐ "Has each of these categories appeared in prior years? If not, why not?"
- ☐ "For run-rate items: what has been realized in cash to date?"
- ☐ "What does the business look like if we exclude all add-backs above $250,000?"
- ☐ "Have any of these adjustments been reviewed or validated by the QoE provider?"
Key Takeaways
- The sponsor’s EBITDA is a starting point, not a conclusion. Institutional underwriting requires lenders to independently reconstruct the earnings base from source documents, not validate management’s schedule. The distance between those two figures is where credit risk hides.
- Documentation is the control mechanism. Every add-back above a materiality threshold must be tied to an audited financial statement, tax return, invoice, contract, or bank payment. If it can’t be sourced, it doesn’t count — regardless of how commercially reasonable it sounds.
- Recurring “one-time” items are the most common form of EBITDA inflation. Trending add-back categories across 3–5 years of historical financials exposes costs that management characterizes as non-recurring but that appear with regularity in the income statement.
- Aggressive add-backs don’t just inflate EBITDA — they compress recovery outcomes. Moody’s data shows a 15-percentage-point recovery penalty for covenant-lite first-lien structures versus those with maintenance covenants. Lenders who accept inflated EBITDA to justify looser covenant packages are compounding two sources of downside risk simultaneously.
- Post-restructuring borrowers face their highest default risk in years one and two. With distressed exchanges accounting for roughly 64% of all defaults in 2025, and more than 70% of subsequent hard defaults occurring within two years of a soft credit event, portfolio monitoring of recently amended credits demands the same analytical rigor as new origination underwriting.


