
Underwriting & Risk Management | Bond Capital
EBITDA Adjustments & Normalization in Credit Underwriting: A Practitioner’s Framework for Lender-Adjusted Earnings
The Underwriting Challenge
A sponsor brings you a confidential information memorandum. The cover page shows a manufacturing company with $10 million in “adjusted EBITDA” and a proposed senior debt facility of $45 million — implying 4.5x leverage. The term sheet looks clean. The business looks fundable. But buried in the financial schedules, $3.2 million of that EBITDA comes from a combination of “one-time” restructuring charges that appeared in three consecutive years, above-market owner salary normalization without third-party benchmarks, projected synergies from an acquisition that closed six weeks ago, and a legal settlement the borrower’s counsel described as “non-recurring.”
Strip those add-backs out and the real leverage is not 4.5x. It is 6.5x — a fundamentally different credit risk profile.
EBITDA normalization is the single most consequential analytical step in leveraged credit underwriting because every downstream metric — leverage ratio, interest coverage, DSCR, covenant headroom — is calculated off the EBITDA denominator. Distort that denominator and you distort your entire picture of the credit. This guide walks through how institutional lenders build a defensible, lender-adjusted EBITDA and why that discipline is more important than ever in today’s private credit market.
The Analytical Framework: Four Versions of EBITDA
Before a credit analyst can normalize EBITDA, they need to understand the waterfall of earnings versions they will encounter in a deal process. There are four distinct stages:
- Reported EBITDA — Raw earnings derived from audited or reviewed financial statements before any adjustments. This is the accounting starting point.
- Management-Adjusted EBITDA — The seller’s proposed bridge. Management identifies possible normalizations, including non-recurring charges, owner compensation adjustments, and one-time items.
- Normalized EBITDA — A more supportable estimate of sustainable earnings, tested and refined through quality of earnings (QoE) review. Non-recurring items are added back; recurring costs that management labeled as one-time are added back in.
- Lender-Adjusted EBITDA — The credit underwriter’s conservative view, which may be more restrictive than what is permitted in the loan agreement’s covenant definition. This is the figure that drives the credit memo and deal approval.
The distinction between versions three and four is critical. Covenant definitions frequently permit a broader universe of add-backs than a disciplined credit officer should accept. The cleanest credit memo shows both borrower-adjusted EBITDA and lender-adjusted EBITDA, with a clear and documented bridge between them. That bridge preserves transparency for approvers, portfolio managers, and future renewal teams.
The Core Add-Back Categories: What Lenders Accept and Reject
Experienced credit analysts organize add-backs into a tiered framework. Not all adjustments are equal in credibility or risk:
| Add-Back Category | Typical Lender Treatment | Key Documentation Required |
|---|---|---|
| Excess owner / executive compensation vs. market rate | Generally accepted, with haircut to verified market comp | Third-party compensation benchmarks (e.g., Radford, Culpepper) |
| Documented one-time legal or restructuring charge | Accepted if truly isolated; rejected if recurring | Invoices, legal opinions, board resolutions |
| Non-cash charges (D&A, stock-based comp, impairments) | D&A accepted by definition; SBC disclosed and sized | Footnotes, equity plan schedules; high-SBC tech companies require close scrutiny |
| Related-party normalization (rent, supplier, management fees) | Accepted only with market-rate evidence | Third-party appraisals, arm’s-length comparables |
| Pro forma revenue from acquisitions or new contracts | High scrutiny; signed contracts only; no projections | Fully executed customer agreements with near-term collectibility |
| Synergies from pending or recent acquisitions | Rejected in standalone lender EBITDA | N/A — belongs to acquirer’s upside model only |
| Vague “miscellaneous” or undocumented expenses | Always rejected | No documentation = no credit |
The governing principle: if a cost is required to generate revenue, serve customers, meet compliance obligations, or maintain the asset base, it must remain in EBITDA. Removing it inflates earnings without reflecting the true cost structure of the business.
Walking the Numbers: A $10M EBITDA Manufacturing Company
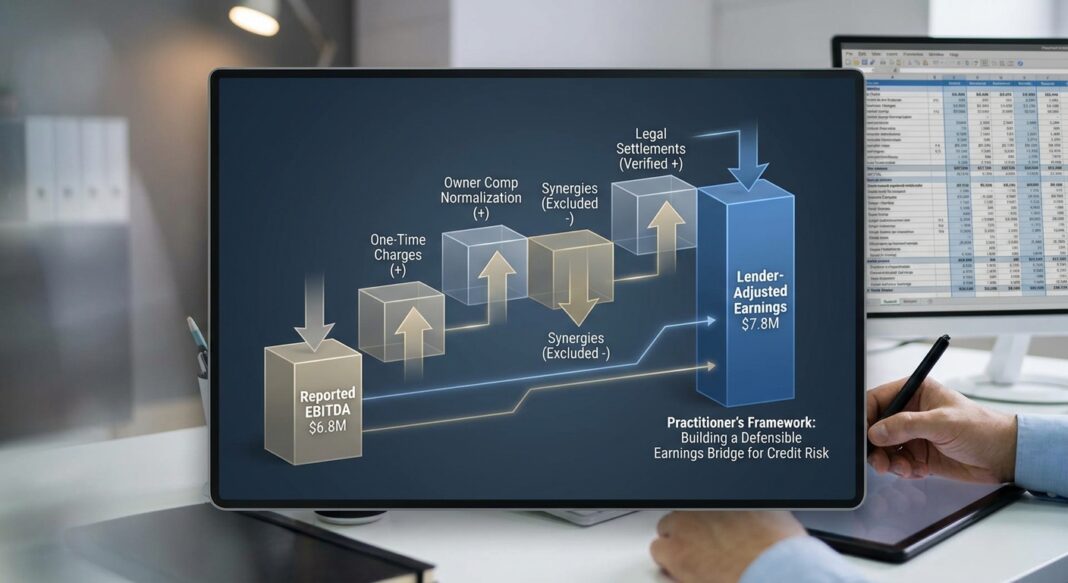
Consider a hypothetical middle-market precision manufacturing business. Management presents $10.0M in adjusted EBITDA. Below is how a credit underwriter rebuilds the number:
| EBITDA Bridge Item | Management Add-Back | Lender Acceptance | Lender Credit |
|---|---|---|---|
| Reported EBITDA (audited) | — | Starting point | $6,800,000 |
| Owner compensation normalization (vs. market CEO comp of $450K) | +$600,000 | Haircut to benchmarked delta | +$400,000 |
| “One-time” restructuring charges (appeared in 2022, 2023, 2024) | +$1,200,000 | Rejected — recurring cost structure | $0 |
| Documented legal settlement (single, isolated event) | +$300,000 | Accepted with legal confirmation | +$300,000 |
| Above-market related-party facility lease (owner-controlled LLC) | +$500,000 | Accepted with appraisal; haircut to $300K delta | +$300,000 |
| Pro forma revenue from new customer contract (unsigned LOI) | +$600,000 | Rejected — no executed agreement | $0 |
| Acquisition synergies (acquired a competitor 8 weeks ago) | +$500,000 | Rejected — belongs to acquirer upside model | $0 |
| Lender-Adjusted EBITDA | $10,000,000 | — | $7,800,000 |
The $2.2 million gap between management EBITDA and lender EBITDA is not a rounding error. Against a $45 million debt facility, leverage on management EBITDA is 4.5x. On lender-adjusted EBITDA, leverage is 5.77x. Interest coverage at a blended all-in rate of 9.5% (a reasonable middle-market benchmark with current SOFR dynamics) shifts from a comfortable 2.2x to a stressed 1.7x — below the 2.0x threshold most institutional lenders treat as a minimum for a secured credit.
Stress Testing the Stack
A rigorous underwriter doesn’t stop at base-case lender EBITDA. They stress it. A standard two-scenario stress test applied to this credit:
- Adverse Case (−10% EBITDA, +50bps rate): EBITDA falls to $7.0M; leverage rises to 6.4x; interest coverage drops to approximately 1.5x — below most covenant floors.
- Severe Case (−20% EBITDA): EBITDA at $6.24M; leverage at 7.2x; coverage near 1.3x. Principal repayment capacity is severely impaired.
This analysis mirrors broader market data. According to S&P Global Ratings, in an adverse scenario with a 10% EBITDA decline and 50-basis-point rate increase, over 25% of middle-market companies fall below 1.0x interest coverage — signaling material distress risk even for borrowers that appear to clear coverage thresholds at origination.
Industry Standards: What Institutional Lenders Benchmark Against
Current Market Leverage Norms
Leverage discipline has tightened materially since the peak era of 2021–2022. Most transactions in the middle market are currently clearing at approximately 5.0x leverage — for businesses with strong cash conversion and clean financial reporting. Upper middle-market buyouts typically secure financing at 5.0x to 5.5x EBITDA, while lower middle-market transactions generally range between 3.5x to 4.5x, providing smaller borrowers with enhanced structural protection. The aggregate middle-market first-lien average stood at approximately 4.5x as of late 2024, according to PGIM, compared to 5.8x in the broadly syndicated loan market — a meaningful disparity that highlights the structural conservatism private credit lenders have maintained at smaller deal sizes.
Critically, S’P Global Ratings found that average leverage across its U.S. middle-market credit estimate population hit 7.0x in 2024, with 20% of companies already below 1.0x EBITDA interest coverage at origination. That is the population into which aggressive EBITDA add-backs are feeding.
The Covenant Erosion Problem
Covenant design has deteriorated in parallel with EBITDA inflation. In the lower middle-market segment (companies with EBITDA below $25 million), approximately 98% of loans historically included at least one maintenance covenant — typically a leverage or interest coverage ratio. In the upper middle-market, approximately 30% of recent deals are now structured as covenant-lite, meaning lenders receive significantly fewer early-warning protections. In the mega-deal segment, approximately 50–55% of new transactions entirely lack financial maintenance covenants. Where covenants do exist, leverage tests often include cushions allowing EBITDA to fall 30–40% before triggering a breach — and EBITDA definitions have expanded to permit wide add-back flexibility, effectively delaying the moment lenders receive a distress signal.
📊 Credit Performance Data Box
- Private Credit Default Rate (2025): Moody’s estimates the private credit default rate in 2025 ranged between 1.6% (excluding distressed exchanges) and 4.7% (including them), with distressed restructurings accounting for approximately 65% of all defaults. (Source: Moody’s, 2026)
- Selective Defaults vs. Conventional Defaults: S&P Global found that selective defaults (PIK conversions, maturity extensions, amortization holidays) outpaced conventional defaults by a 5-to-1 ratio in 2024 — a pattern obscured by narrow official default definitions. (Source: S&P Global Market Intelligence, 2025)
- Senior Secured Recovery Rates: Moody’s long-term data shows first-lien senior secured loans have historically recovered approximately 60–80% of principal at default. The projected 2024 average of 57.6% fell below the long-term average of 65.0%, driven by structural deterioration and flexible credit documentation. (Source: Moody’s Default & Recovery Database, 2024)
- High-Yield Default Rate Forecast: Moody’s projected a high-yield bond realized default rate of 3.2% for calendar year 2025, with the rate forecast to rise above 4% by Q1 2026 — though still below the 4.5% historical annual average since 1996. (Source: Moody’s US Credit Review, July 2025)
- KBRA Direct Lending Index: The KBRA DLD Direct Lending Index recorded a trailing 12-month default rate of 1.8% as of September 2025, mirroring the 1.8% rate at year-end 2024 — materially below thresholds that would raise systemic concern, but elevated against pre-2022 norms. (Source: Valuation Research Corporation, citing KBRA DLD, 2025)
Common Red Flags Experienced Lenders Watch For
- Recurring “one-time” charges: A company reporting non-recurring restructuring or litigation costs in multiple consecutive periods does not have non-recurring costs — it has a recurring cost structure. Any add-back that has appeared in more than one period should be challenged and likely rejected.
- Stock-based compensation without disclosure: For high-SBC technology companies, excluding stock-based compensation without flagging it can inflate normalized EBITDA by 10–20%, and the dilution and cash burden of SBC must be assessed on its own terms.
- Synergies embedded in standalone EBITDA: Synergies belong to the acquirer’s model — not to the target’s normalized standalone earnings. Mixing them into the underwritten EBITDA is a fundamental error that overstates the credit’s inherent earnings power.
- EBITDA definition creep in covenants: Where covenant EBITDA definitions allow broader add-backs than a conservative lender would accept, the underwriter must maintain a separate, internal lender-adjusted EBITDA for credit decisioning, even if the legal document permits a higher number for covenant compliance testing.
- Related-party transactions without market evidence: Above-market or below-market related-party purchasing, leasing, or management fee arrangements can distort gross margin and operating expenses in either direction. Normalization requires actual invoices, contracts, and third-party market benchmarks — not management assertions.
Underwriting Checklist: EBITDA Normalization Diligence
Use this step-by-step framework on every leveraged credit requiring EBITDA normalization:
-
Start from Audited or Reviewed Financials
- Obtain three years of audited financial statements (five years for larger credits)
- Identify any restatements, auditor changes, or qualified opinions
- Reconcile management EBITDA to reported net income line-by-line
-
Build the Add-Back Bridge
- List every proposed adjustment with its dollar amount and stated rationale
- Require source documentation for each item (invoices, contracts, board minutes)
- Flag any add-back that recurs across more than one period — treat it as recurring
- Apply the test: “Is this cost required to operate the business?” If yes, leave it in
-
Normalize Owner / Executive Compensation
- Benchmark current owner or key executive pay against verified third-party market data
- Adjust to market rate; document the delta and its source
- Confirm replacement cost if the owner departs post-closing
-
Evaluate Related-Party Transactions
- Identify all transactions between the borrower and related entities (leases, purchasing, services)
- Obtain appraisals or market comparables for all material related-party terms
- Normalize above- or below-market arrangements to arm’s-length economics
-
Separate Historical, Run-Rate, and Pro Forma Adjustments
- Historical normalizations: distortions already in the financials — highest credibility
- Implemented run-rate changes: give partial credit only if already visible in trailing results
- Prospective improvements and synergies: exclude from lender-adjusted EBITDA entirely
-
Calculate Key Credit Metrics on Lender-Adjusted EBITDA
- Total Leverage: Total Debt ÷ Lender EBITDA
- Net Leverage: (Total Debt − Unrestricted Cash) ÷ Lender EBITDA
- Interest Coverage: Lender EBITDA ÷ Cash Interest Expense
- FCCR: (Lender EBITDA − Taxes − Capex) ÷ (Interest + Scheduled Principal)
- Flag any metric below institutional threshold: leverage >5.5x or coverage <2.0x warrants elevated scrutiny
-
Run Stress Scenarios
- Adverse: −10% EBITDA, +50bps interest rate; test covenant headroom
- Severe: −20% EBITDA; test debt service capacity and liquidity runway
- Document how leverage and coverage migrate across scenarios
-
Align Covenant Definition with Underwritten EBITDA
- Review the loan agreement’s EBITDA definition and permitted add-backs
- Ensure covenant leverage test is set at a level consistent with lender-adjusted EBITDA, not management EBITDA
- Consider pairing leverage covenants with minimum liquidity thresholds as a secondary protection
-
Document the Bridge in the Credit Memo
- Present both borrower-adjusted and lender-adjusted EBITDA with a clear, line-by-line reconciliation
- State the rationale for each adjustment accepted, partially accepted, or rejected
- This bridge is the single most auditable element of the underwriting file
Key Takeaways
- The denominator determines everything. EBITDA is the denominator in every critical credit metric — leverage, coverage, DSCR, and covenant headroom. An inflated EBITDA doesn’t make the credit safer; it makes the danger invisible until it is too late to act.
- Borrower EBITDA and lender EBITDA are not the same number. The best credit memos always show both, with a transparent bridge. The gap between them is itself a risk signal: a large gap on a small company is a structural warning, not just a negotiating footnote.
- Recurrence is the decisive test. Any expense that has appeared in more than one period is, by definition, recurring. “One-time” charges in consecutive years reflect a recurring cost structure, not isolated misfortune. Underwriters who accept these add-backs are underwriting fantasy earnings.
- Covenant design must follow lender-adjusted EBITDA, not borrower EBITDA. When covenant definitions permit broader add-backs than a conservative underwriter accepts, lenders receive a false sense of compliance headroom. The erosion of covenant discipline — with approximately 30% of upper middle-market deals now covenant-lite — makes lender-adjusted EBITDA discipline at origination the primary protection against deterioration going undetected.
- Stress testing is not optional. Default and recovery data confirm that recoveries are declining (2024 first-lien recovery projections fell below the long-term average) and that selective defaults are outpacing conventional ones. Stress-testing EBITDA at origination — across at least two scenarios — is the only way to underwrite a credit that holds up when business conditions do not.


