
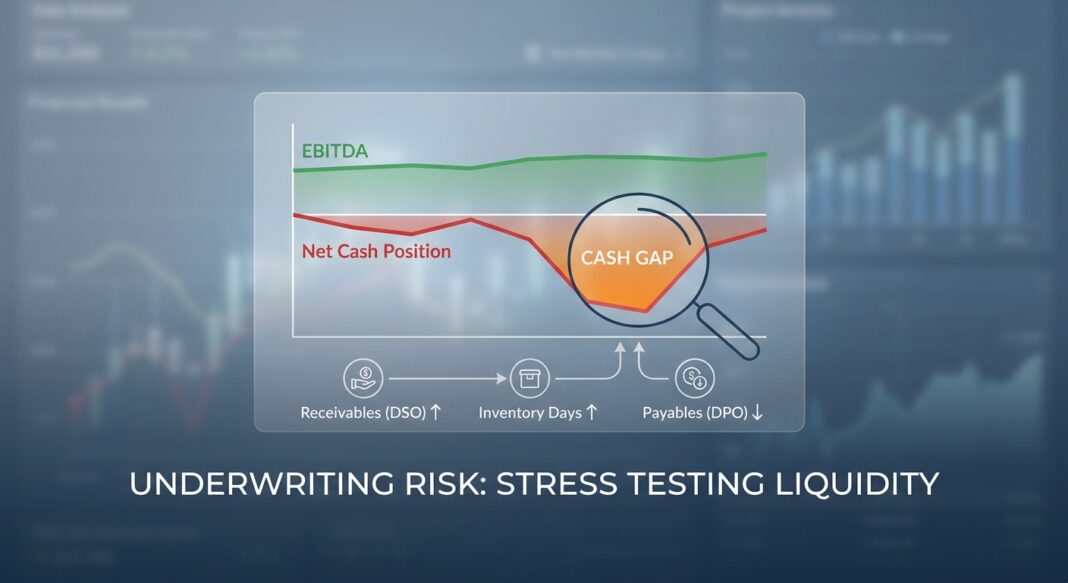
The underwriting question
Can a borrower meet debt service if customers pay later and inventory takes longer to sell, even when EBITDA remains positive? For a manufacturer, the answer may turn on a few weeks of working capital. Accounts receivable rises when collections slow. Inventory consumes cash when demand forecasts miss or production batches grow. Suppliers may shorten payment terms at the same time. Those movements can absorb liquidity before the income statement shows a material earnings decline.
That is why a lender should not treat EBITDA, cash interest coverage, and liquidity as interchangeable measures. EBITDA tests operating earnings. Interest coverage compares earnings with interest expense. Neither captures cash trapped in receivables and stock. A useful underwriting case reconciles operating performance to a cash trough, identifies when the trough occurs, and tests whether committed liquidity and covenant headroom remain available. The analysis below uses a hypothetical $10 million EBITDA manufacturer. All company-level inputs are illustrative assumptions, not reported market data.
The framework: bridge earnings to cash
Start with monthly or quarterly historical statements, not only annual audited accounts. Reconcile reported sales and EBITDA to the general ledger, then match sales, collections, purchases, and payments to bank activity. Build a seasonal baseline using at least 24 months of monthly data where available. Separate recurring seasonality from one-off disruptions, and reconcile the resulting working-capital movements to balance-sheet changes.
Track three operating measures. Days sales outstanding (DSO) equals average trade receivables divided by credit sales, multiplied by 365. Inventory days equals average inventory divided by cost of goods sold, multiplied by 365. Days payable outstanding (DPO) equals average trade payables divided by purchases or cost of goods sold, multiplied by 365. The cash conversion cycle is DSO plus inventory days minus DPO. Calculate each by month and compare it with customer terms, supplier contracts, and the borrower’s own history.
Then build a cash bridge: opening unrestricted cash, plus cash earnings, less cash interest, scheduled principal, taxes, maintenance capital expenditure, distributions, and the increase in net working capital. Forecast revolver availability separately. Availability is not cash if the borrowing base is shrinking, eligibility exclusions are rising, or a covenant blocks further draws. Include letters of credit and outstanding checks in liquidity.
Use at least a base case and a downside case. The downside should connect operational drivers to financial outputs: volume, price, gross margin, customer payment behavior, inventory turns, supplier terms, and capex. Avoid a single percentage haircut to EBITDA that leaves working capital untouched. The Federal Deposit Insurance Corporation’s November 2026 examination manual says leveraged underwriting should assess historical and projected performance, underlying assumptions, repayment sources, and the borrower’s capacity to delever. FDIC, RMS Manual of Examination Policies, Section 3.2, Loans.
Illustrative analysis: $10 million EBITDA manufacturer
Assume revenue of $80 million, EBITDA of $10 million, total debt of $35 million, and unrestricted cash of $3 million. Net leverage is ($35 million minus $3 million) divided by $10 million, or 3.2x. Assume cash interest of $3.15 million, scheduled annual principal of $0.70 million, maintenance capex of $2.0 million, and cash taxes of $0.60 million. These assumptions imply 3.17x EBITDA-to-cash-interest coverage before stress.
Now assume sales fall 10% to $72 million and the EBITDA margin declines from 12.5% to 11.0%. Stressed EBITDA is $72 million times 11.0%, or $7.92 million. Cash interest coverage falls to 2.51x. Separately, assume DSO worsens by 10 days and inventory days rise by seven, while supplier terms remain unchanged. At stressed sales, the receivables build is approximately $72 million divided by 365, multiplied by 10, or $1.97 million. Assuming cost of goods sold is 60% of sales, the inventory build is approximately $43.2 million divided by 365, multiplied by seven, or $0.83 million. The combined working-capital cash use is about $2.80 million.
After interest, principal, capex, taxes, and this working-capital use, the annual cash deficit is about $1.33 million: $7.92 million minus $3.15 million, $0.70 million, $2.0 million, $0.60 million, and $2.80 million. Cash falls from $3.0 million to approximately $1.67 million, before revolver draws or other cash movements. Against an illustrative $2.0 million minimum-liquidity threshold, the borrower breaches the threshold despite positive EBITDA and 2.51x interest coverage. The timing matters: a quarter-end snapshot can miss a deeper intra-quarter trough. A weekly 13-week cash forecast should test that timing.
Industry standards and credit performance
Institutional diligence should examine both the borrower’s cash conversion and the evidence supporting its forecast. Obtain monthly receivables and payables aging, inventory by category and location, write-off and reserve histories, purchase commitments, customer order books, supplier terms, and borrowing-base certificates. Test aging buckets against subsequent cash receipts. Identify disputed invoices, consignment stock, obsolete inventory, customer rebates, and supplier finance arrangements. These can make reported working capital look more liquid than it is. S&P Global Market Intelligence, October 8, 2026 identifies changing liquidity, customer relationships, working-capital needs, and payment behavior as borrower-level risk factors that can shift quickly in SME and lower-middle-market credits.
Recent default figures require careful comparison because populations and definitions differ. Moody’s Ratings reported six speculative-grade corporate defaults in October 2026, five involving distressed exchanges; its global trailing-12-month speculative-grade default rate was 4.3% at October 31, 2026, versus a reported long-term average of 4.2%. Moody’s October 2026 Default Report, published November 19, 2026. For a different population, Proskauer’s Private Credit Default Index reported a 2.41% default rate for July 1 through September 30, 2026, across 746 U.S. senior-secured and unitranche loans representing $205.7 billion of original principal. The rate was 2.51% in Q2 2026. Proskauer, October 27, 2026. These rates are not directly comparable. A low headline rate does not remove the need to identify a borrower’s liquidity path and restructuring risk.
Common underwriting errors include using year-end working-capital balances to represent peak seasonal needs, treating all receivables and inventory as eligible collateral, assuming sponsor support without documentation, and relying on refinancing as the only repayment source. Monitoring should include monthly borrowing-base reporting when relevant, variance analysis against the cash forecast, and escalation thresholds for overdue receivables, inventory growth, liquidity decline, or missed financial reporting. The FDIC’s current manual also calls for lifecycle monitoring of leveraged loans and a clear risk appetite and concentration controls.
Underwriting checklist
- Collect three years of audited or reviewed financial statements, monthly management accounts, bank statements, and a current debt schedule. Reconcile reported cash and debt to bank confirmations.
- Request 24 to 36 months of monthly AR, AP, and inventory aging, sales by customer, purchases by supplier, credit memos, write-offs, and inventory reserves. Trace selected invoices and subsequent receipts or payments.
- Ask what drives each material DSO, inventory-day, and DPO change. Are customer terms contractually fixed? Are supplier discounts or extended terms temporary? Which inventory is obsolete, work in process, customer-specific, or subject to a lien?
- Require a monthly operating forecast and weekly 13-week cash flow for downside periods. Reconcile cash changes to EBITDA, interest, principal, taxes, capex, working capital, and other uses.
- Document minimum liquidity, reporting frequency, borrowing-base tests where applicable, covenant definitions, cure rights, and notice requirements. Set internal early-warning triggers ahead of contractual breach, and assign an owner and response timeline for each trigger.
Key takeaways
- Positive EBITDA does not prove near-term liquidity.
- Model receivables, inventory, and payables as separate cash drivers.
- Test the timing of the trough, not only quarter-end leverage.
- Reconcile lender availability to eligible collateral and covenant capacity.
- Use early-warning triggers before a minimum-liquidity breach.


