
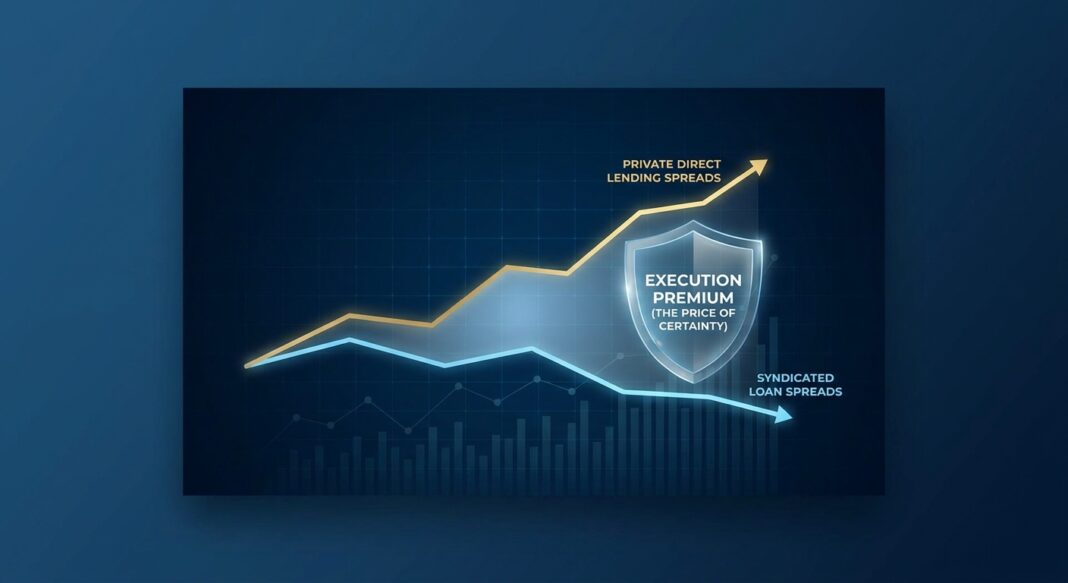
The Price of Certainty Widens the Direct-Lending Gap
Market headline
Credit is not uniformly tightening. Pricing is separating by execution channel: private direct-lending spreads have widened while broadly syndicated loan spreads tightened, and the larger syndicated market is winning more large buyout and refinancing transactions. PitchBook LCD’s October Private Credit Monitor, published November 6, reports direct-lending volume edged higher over the latest three months but on fewer, larger deals; year-to-date activity remained below 2025, with buyout financing at its lowest level since 2020. The report says syndicated lenders led sponsor-backed and buyout volume and refinanced more direct loans than private lenders took out of the syndicated market. Source: PitchBook LCD, October 2026 US Private Credit Monitor, November 6, 2026.
The divergence is visible in terms. PitchBook LCD’s Q3 direct-lending LBO spread average was 520 basis points, up from 494 in Q2 and 475 in Q1. By contrast, the syndicated loan index’s three-year discount margin ended October at 510 basis points, 28 basis points wider than September, while UBS reports syndicated new-issue pricing tightened against private lending over the quarter. These are different measures and borrower pools, not a like-for-like spread series. Still, the direction indicates that private execution certainty now carries a larger observed spread premium. Borrowers are paying for that certainty while lenders screen harder for cash flow, sector durability and refinance capacity.
Bank lending data do not show a general retreat. In the Federal Reserve’s October SLOOS, covering Q3, standards for C&I loans to large and middle-market borrowers were basically unchanged, while standards tightened for small firms and on premiums charged to riskier borrowers. This is a selective market, not a simple bank-vacuum story. The more material cycle signal is stress beneath headline spreads: private-credit default measures remain elevated, public loan distress rose in October, and leverage in several private-credit sectors remains high. Source: Federal Reserve, October 2026 SLOOS, published November 2, 2026.
Quantitative snapshot
Data below use the latest monthly or quarterly release available by November 21, 2026. Spread definitions differ across markets. The numbers should be read as market indicators, not as directly interchangeable quotes.
| Metric | Latest reading and comparison | Source |
|---|---|---|
| Private direct-lending LBO spread | 520 bps in Q3 2026, versus 494 bps in Q2 and 475 bps in Q1. | PitchBook LCD data, reported November 19 |
| Private loan clearing spread | S+549 average nominal spread, the widest since Q4 2024; reported November 19. | Covenant Review, as reported by Goodwin |
| Public loan spread / yield | 510 bps three-year discount margin at October 31, up 28 bps month over month; 9.56% index yield, down 6 bps. | UBS Credit Investments Group, November 11 |
| High-yield bond spread / yield | 344 bps OAS and 8.30% yield-to-worst at October 31; OAS widened 32 bps in October. | UBS Credit Investments Group, November 11 |
| Private-credit defaults | 1.5% of loan principal in Q3, versus 0.8% in Q2, per Houlihan Lokey’s size-weighted measure. | Houlihan Lokey, November 19 |
| Fundraising and bank standards | Private-credit fundraising reached $185bn through Q3, 95% of all 2025; 88.3% of banks reported unchanged C&I standards for large/middle-market firms in Q3. | Preqin, November 8; Federal Reserve |
The spread premium between private and syndicated transactions is meaningful but not a pure apples-to-apples comparison: the 520-bp direct-lending figure covers new LBOs, while the syndicated 510-bp figure is an index discount margin. Deal size, rating, fees, OID, floors, covenants and amortization all change effective cost. UBS also recorded $42.1bn of syndicated loan issuance in October, including $25.6bn net new issuance, and $14.6bn of high-yield issuance, including $9.4bn net new. Its October trailing-12-month default rates, including distressed exchanges, were 1.96% for loans and 2.63% for high-yield bonds. Those differ from Houlihan Lokey’s private-credit principal-weighted measure, which rose to 1.5% in Q3 from 0.8% in Q2. The denominator and event definitions differ, so the figures are signals of dispersion, not a ranking of risk. UBS, November 11, 2026.
Sector analysis
Software is the clearest stress-and-selection case. The IMF’s October 2026 Financial Stability Report, drawing on S&P Global Ratings’ reviewed US direct-lending borrowers, put median software debt-to-adjusted-EBITDA at 8.1x in Q2, up from 8.0x in 2025 and 7.6x in 2024. That leverage is a weak starting point for borrowers whose recurring-revenue durability lenders are reassessing amid AI competition. Public-market performance shows the risk is not limited to one borrower cohort: UBS reported that US loan software had a negative return in October, while utilities, energy and metals/minerals were positive. A monthly return is not a lender appetite survey, but it is a current price signal. IMF, Global Financial Stability Report, October 2026. UBS, November 11, 2026.
Consumer services have a more direct balance-sheet warning. IMF data show median direct-borrower leverage at 8.55x in Q2 2026, versus 7.85x in 2025. The same dataset puts commercial services at 7.2x, up from 6.45x, and professional services at 6.85x, up from 6.3x. By contrast, healthcare providers’ median fell to 6.95x from 7.45x in 2025, although Houlihan Lokey identifies healthcare and consumer as sectors with the most Q3 default stress. The contrast matters: a sector average may look more manageable even as weaker companies deteriorate. IMF sector leverage data, Q2 2026. Houlihan Lokey, November 19, 2026.
In public loans, October’s strongest sector returns were energy at 0.40%, utilities at 0.28% and metals/minerals at 0.26%. Chemicals returned -1.48%, media/telecom -1.15% and housing -1.00%. These marks point to relative resilience in hard-asset and commodity-linked exposures and pressure in sectors sensitive to input costs, demand or business-model change, but they do not establish that private lenders are increasing allocations. UBS Credit Investments Group, October returns published November 11, 2026.
Private-credit supply is still substantial, but fundraising is concentrated and deployment selective. Preqin says $185bn was raised through Q3 despite substantially fewer fund closes, while 79% of surveyed LPs expected to commit to only one private-credit fund over the next 12 months. That combination favors established platforms and proven underwriting over managers relying on broad market beta. At the same time, the Fed’s SLOOS describes large and middle-market bank C&I standards as broadly unchanged, but reports tighter standards for small firms and riskier-loan premiums. Availability therefore depends on size and credit quality, not simply whether a borrower seeks a bank or nonbank loan. Preqin, November 8, 2026. Federal Reserve, November 2, 2026.
Implications
What this means for borrowers
Borrowers should compare total financing cost and documentation, not headline spread alone. A private quote at a wider spread may still be preferable where certainty, speed, delayed draws or tailored covenants matter, but the economic trade-off should include OID, fees, minimum cash interest, amortization, call protection and liquidity availability. Prepare a lender-ready cash-flow bridge: EBITDA adjustments, working-capital seasonality, capex, cash taxes and funded debt service. Underwrite FCCR under both base-rate and revenue downside cases, and show how covenant headroom moves if EBITDA falls or rates rise. Current sources do not establish one market-wide FCCR or debt-to-equity approval threshold, so borrowers should request lender-specific tests rather than assume a universal hurdle.
For software and services businesses, document customer retention, net revenue retention, renewal cohorts, pricing power and exposure to AI substitution at the product level. For consumer and healthcare operators, give lenders current liquidity forecasts and a 13-week cash view, not just adjusted EBITDA. The Q3 default rise among sub-$100m EBITDA borrowers makes reporting quality and cash control especially consequential. Houlihan Lokey, November 19, 2026.
What this means for lenders and investors
For lenders, wider direct spreads are compensation only if leverage, entry valuation and downside protections are consistent with realized cash flows. Stress-test add-backs, recurring-revenue assumptions and contingent liquidity commitments. IMF reported median leverage across its reviewed direct borrowers at 7.05x in Q2, up from 6.6x in 2025, and noted that some funds’ borrower commitments exceed their available liquidity and borrowing capacity. For investors, scrutinize vehicle-level liquidity, valuation marks, PIK and amendment activity alongside stated default rates. The IMF notes that extensions and amendments can affect reported defaults, while the different public and private definitions further limit headline comparisons. IMF, October 2026.
Over the next three to six months, the likely market path is continued channel bifurcation rather than a uniform credit freeze. If syndicated issuance stays open, larger and stronger borrowers can use public markets to reduce refinancing costs, leaving direct lenders competing on execution and structure. Weaker borrowers, smaller businesses and sectors facing technology or demand disruption may encounter higher spreads, lower leverage and tighter covenants. Monitor monthly public-market distress, quarterly private-credit amendments and defaults, and the next Fed lending survey. The key test is whether cash-flow coverage improves before maturities and liquidity needs force restructurings.
Key market insights
- Direct-lending LBO spreads moved from 475 bps in Q1 to 520 bps in Q3, while syndicated spreads tightened: the execution premium has widened.
- Fundraising remains strong, but fewer closes and LP concentration indicate capital availability is not equal to deployment capacity.
- Do not equate public and private default percentages without checking denominators, event definitions and treatment of extensions or PIK.
- Sector-level leverage is a starting point, not a credit conclusion. Test borrower-specific FCCR, liquidity and exposure to structural change.
- For operators, a clean cash-flow case and transparent downside plan are increasingly important components of financing access.


