
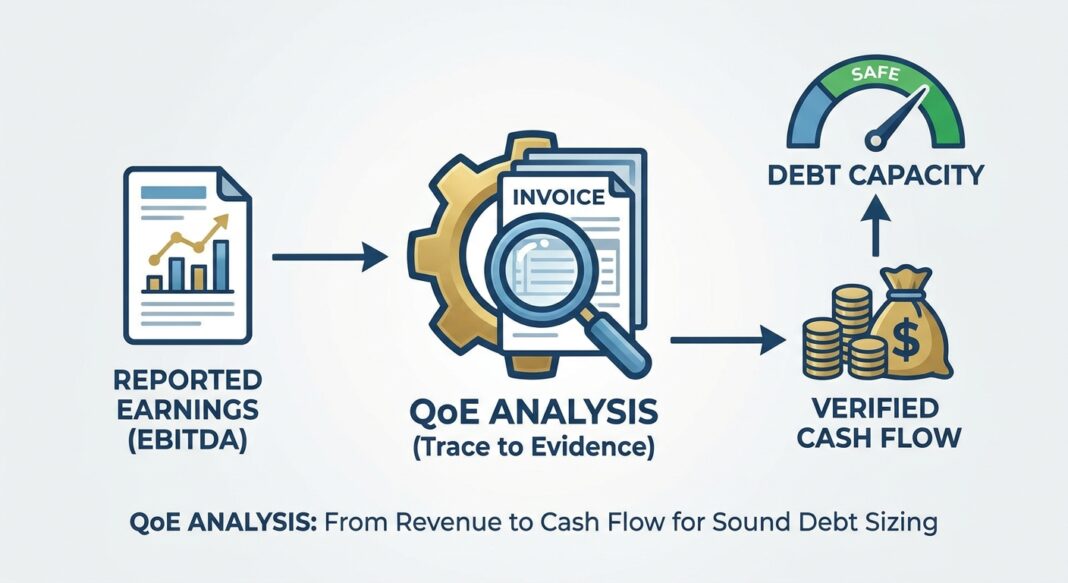
Can a borrower turn reported revenue into cash quickly enough to service debt? A quality of earnings (QoE) review should answer that before a lender relies on management-adjusted EBITDA. Revenue can be recorded correctly under the accounting policy yet still be weak credit evidence if collections lag, customer acceptance is pending, or growth consumes working capital faster than the business generates it. A year-end EBITDA figure alone will not expose those risks.
For lenders, the objective is not to produce a transaction valuation. It is to establish a supportable earnings base, identify cash-conversion demands, and test whether debt service remains covered when assumptions weaken. The work should reconcile operating results to source records and explain material movements, not merely repeat the company’s presentation. That distinction matters most in lower-middle-market businesses, where reporting systems may be less mature and a small number of customers, contracts, or month-end entries can materially change the credit picture.
The Framework: Reconcile the Earnings Story to Evidence
Begin with monthly income statements, trial balances, general-ledger detail, bank statements, tax returns, and audited or reviewed financial statements where available. Tie the reported revenue and expense totals to the ledger, then compare monthly results across at least two fiscal years and the latest trailing-twelve-month period. Investigate breaks in accounting policy, cutoff, margin, or seasonality. The CFA Institute’s 2026 financial-reporting-quality curriculum likewise emphasizes understanding the business, comparing periods, reviewing unusual recognition policies, analyzing cash-flow differences, and examining risk disclosures (CFA Institute, Evaluating Quality of Financial Reports).
Next, test revenue by customer, product, contract type, and month. Trace samples from contract or purchase order to shipment or service evidence, invoice, ledger posting, and subsequent cash receipt. Test both sides of the period-end cutoff. Review credit notes, returns, rebates, unbilled receivables, contract assets, deferred revenue, and subsequent write-offs. Compare revenue growth with units, pricing, customer retention, and accounts-receivable aging. A growing top line paired with slower collections or a rising share of past-due balances needs explanation.
Build an earnings bridge from reported EBITDA to lender-underwritten EBITDA. Accept an adjustment only when it is nonrecurring, supported by documentation, and not required to maintain ordinary operations. Separately calculate working-capital investment, cash taxes, maintenance capital expenditure, cash interest, and scheduled principal. Core ratios include total debt / lender EBITDA, lender EBITDA / cash interest, and cash flow available for debt service (CFADS) / scheduled debt service. Show the numerator and denominator, period, and adjustments for each metric.
For example, assume a manufacturer reports $10 million of EBITDA on $80 million of revenue. That $10 million is only a starting point. The lender must validate the revenue and margin, decide which add-backs survive evidence testing, and determine how much cash is absorbed by receivables, inventory, and required capital expenditure. Do not treat a QoE conclusion as a substitute for a cash-flow forecast or legal-document review.
The Analysis: Follow a $10 Million EBITDA Borrower Through Cash Flow
Use an explicitly illustrative case. Assume the borrower reports $10.0 million EBITDA, $3.0 million cash interest, $0.5 million cash taxes, $1.2 million maintenance capital expenditure, and a normalized $1.5 million annual working-capital cash use. Assume scheduled principal is $2.5 million.
Reported EBITDA / cash interest is 3.33x ($10.0 million / $3.0 million). That looks adequate in isolation. Calculate CFADS before debt service as EBITDA less cash taxes, maintenance capital expenditure, and working-capital use: $10.0 million – $0.5 million – $1.2 million – $1.5 million = $6.8 million. Total scheduled debt service is $5.5 million, so CFADS coverage is 1.24x ($6.8 million / $5.5 million).
Now suppose invoice testing identifies $0.8 million of revenue recognized before the contractual acceptance condition was met, and documentation does not support recognizing it in the tested period. For illustration, reducing EBITDA by $0.8 million lowers CFADS to $6.0 million if the other assumptions hold, and coverage to 1.09x ($6.0 million / $5.5 million). That is not an automatic accounting conclusion for every contract. It is a diligence finding that must be checked against contract terms and the applicable accounting policy. The exercise shows why earnings evidence and cash conversion can matter more than the headline leverage or interest-coverage ratio.
Run downside cases as well. Recalculate coverage with lower volume or gross margin, slower collections, higher inventory days, and a floating-rate interest increase. Avoid combining every shock into one opaque haircut. Show each driver, the resulting liquidity draw, minimum cash balance, revolver availability, and covenant headroom. A forecast that breaches a maintenance covenant before the cash low point indicates that contractual intervention may arrive too late.
Industry Standards and Current Credit Evidence
Institutional lenders generally expect a traceable earnings bridge, consistent accounting, support for material adjustments, a clear working-capital analysis, and a reconciliation between reported profit and cash generation. The diligence file should preserve source documents and record unresolved items, responsible parties, and the effect on underwriting. The CFA Institute framework supports scrutiny of cash-flow differences, recognition policies, financial ratios, risk disclosures, and insider transactions. These principles are relevant to credit analysis even though a financial-reporting review is not itself a loan-underwriting standard.
Recent performance data reinforces the need to distinguish headline default measures from borrower-level signals. Houlihan Lokey’s November 19, 2026 release reports Q3 2026 private-credit defaults of 1.5% of loan principal and 3.7% by borrower count; for borrowers below $100 million EBITDA, the figures were 3.9% and 5.0%, respectively. It also reports median interest coverage of 1.68x in September 2026, with 15.1% of borrowers below 1.0x. The dataset and default definition are specific to Houlihan Lokey’s proprietary DataBank (Houlihan Lokey, Q3 2026 Private Credit DataBank findings, November 19, 2026).
Moody’s Ratings reported on November 19, 2026 that the trailing-12-month global speculative-grade default rate was 4.3% at October-end, compared with a 4.2% long-term average. This is a rated global issuer measure, not a directly comparable private-credit statistic. Moody’s also reported that six speculative-grade issuers defaulted in October, five in North America, and that five of the six events were distressed exchanges (Moody’s, October 2026 Default Report, published November 19, 2026).
Common QoE warning signs include unsupported cutoff entries, rising receivables or contract assets without matching collections, recurring “one-time” costs, unexplained margin expansion, customer concentration masked by aggregate revenue, and adjustments that shift ongoing costs outside EBITDA. Treat persistent cash interest deferral, maturity extensions, or a liquidity need disguised by add-backs as credit signals requiring follow-up, not as proof of improved earnings.
Underwriting Checklist
- Obtain monthly financial statements, trial balances, general-ledger detail, tax returns, bank statements, customer-level sales, accounts-receivable aging, and inventory records. Reconcile statements to the ledger and investigate unexplained differences.
- Test revenue cutoff around period-end using contracts, orders, shipping or service records, invoices, acceptance terms, credit notes, and subsequent receipts. Examine unbilled revenue, deferred revenue, returns, rebates, and write-offs.
- Reconcile reported EBITDA to lender EBITDA. Require evidence for each adjustment and reject recurring operating costs presented as exceptional.
- Analyze customer concentration, retention, pricing, volume, gross margin, collection trends, inventory turns, payables, and normalized working-capital needs. Identify seasonality and peak borrowing requirements.
- Calculate leverage, cash-interest coverage, CFADS, debt-service coverage, minimum liquidity, and covenant headroom on both base and downside cases. Tie forecast assumptions to operating evidence.
- Document outstanding diligence questions, covenant definitions, reporting frequency, required financial statements, borrowing-base or liquidity reporting where applicable, and triggers for earlier lender review.
Key Takeaways
- Revenue quality requires evidence of performance, correct cutoff, and collection patterns.
- A defensible EBITDA bridge is only one input to debt capacity; working-capital use and maintenance capex also consume cash.
- Calculate coverage from clearly defined cash flows and scheduled debt service, not from an unlabeled ratio.
- Separate scenario drivers so lenders can see which operating shock creates a liquidity or covenant breach.
- Interpret default statistics within each provider’s universe and definition. Do not treat different datasets as interchangeable.


