
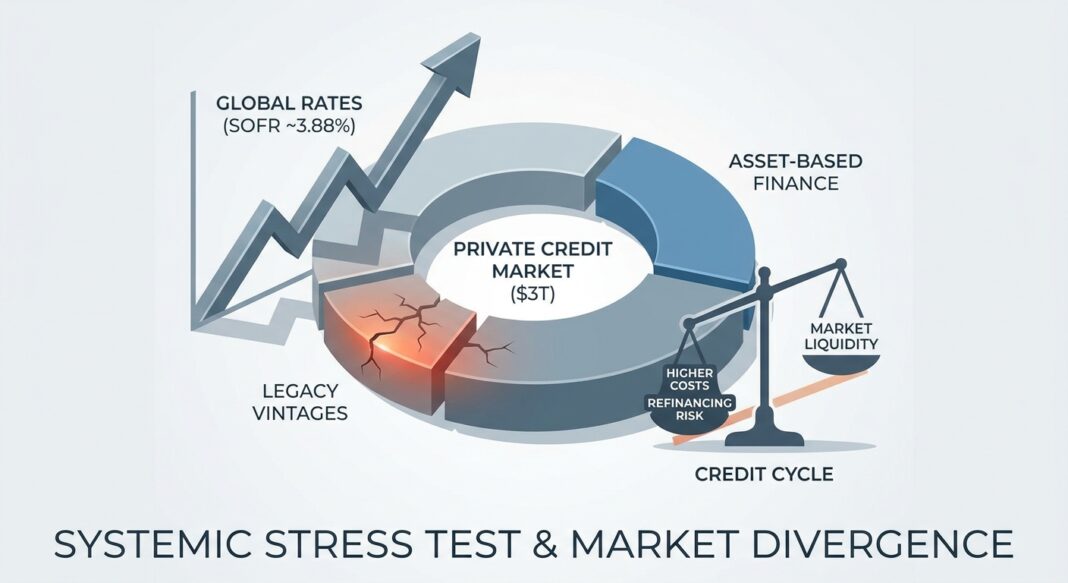
Higher-for-Longer Bites Back: Private Credit Enters Its First Real Credit Cycle
With the Fed funds rate at 4.00% and futures markets pricing further hikes to ~4.7% by late 2027, the $3 trillion private credit market is confronting its first systemic stress test — and the divergence between disciplined and undisciplined lenders has never been wider.
The Main Story: A Lender-Friendly Reset — But Not Without Pain
For institutional investors and operating executives who rely on credit markets to finance acquisitions, recapitalizations, and organic growth, Q4 2026 marks a decisive inflection point. The macro script that private credit was written on — near-zero base rates, compressed bank margins, and an inexhaustible bid from yield-starved allocators — has inverted. SOFR sits at 3.88%, futures markets are pricing the effective funds rate to ~4.7% by October 2027, and the Fed raised 25bps at its September 15–16 FOMC meeting — with most policymakers signaling at least one additional hike before year-end.
The asset class has grown into a ~$3 trillion global market, and it is now encountering the consequences of the leverage and underwriting decisions made during 2021–2022 when base rates were at historic lows. New issuance spreads remain approximately 25–50 bps higher than year-end 2025 levels following widening observed in March, though market conditions stabilized through Q3. The story is no longer simply about spread compression. It is about credit differentiation, vintage stress, and the structural reorientation of where private capital will flow next.
Two-thirds of private credit fund managers (67%) cite greater competition as the primary driver affecting 2026 performance, followed by defaults and credit losses at 64% — a stark contrast to the consensus optimism of just 18 months ago. The market is not in crisis, but it is in its first genuine credit cycle, and the divergence between experienced managers with robust underwriting frameworks and those who chased yield without commensurate discipline is widening by the quarter.
Quantitative Market Snapshot
The data below synthesizes the most current available pricing, volume, and underwriting metrics as of Q3/Q4 2026. All figures are sourced from primary market data providers.
📊 Key Market Metrics — October 2026
| Metric | Current Value (Q3/Q4 2026) | Prior Period | Change | Source |
|---|---|---|---|---|
| 3M Term SOFR (Benchmark) | ~3.88% | ~3.63% (YE 2025) | +25 bps YTD | NY Fed / sofrrate.com |
| Middle Market Unitranche Spread (New Issue) | SOFR + 475–575 bps (all-in ~8.6%–9.6%) | SOFR + 450–550 bps (YE 2025) | +25–50 bps | VRC Q3 2026 |
| Large-Cap Direct Lending Spread | ~SOFR + 480–500 bps | ~SOFR + 300–350 bps (pre-Q1 2026 widening) | +150–200 bps from prior cycle lows | Octus / PitchBook LCD |
| Lower Middle Market Spread Premium | +232 bps over large-cap (approx. SOFR + 700+ bps) | Narrower in 2024 | Premium widened | Avante Capital / Heron Finance Q1 2026 |
| High Yield Bond Spread (Public) | 315 bps over Treasuries (all-in yield 8.11%) | 270 bps (July 8, 2026) | +45 bps since July | StreetStats / ICE Index, Oct 8 2026 |
| Private Credit vs. High Yield Illiquidity Premium | ~150–200 bps | ~350 bps (2019) | Compressed ~150–200 bps since 2019 | Owners.PE Analysis, April 2026 |
| Private Debt Issuance (YTD through May 2026) | ~$87.2 billion | Higher in same period 2025 | –24.6% YoY | VRC Q2 2026 / PitchBook |
| New Deal Leverage (High-Quality Transactions) | 5.0x–6.0x Debt/EBITDA | More aggressive pre-March 2026 | Standards tightening post-March | VRC Q2 2026 |
| Middle Market Interest Coverage (FCCR Proxy) | ~1.7x–1.8x (new deals); 2021 vintages ~1.5x | ~2.2x at underwriting (2021–22 vintages) | –0.4x average decline on legacy book | Columbia Threadneedle; VRC Q2 2026 |
| Adjusted Private Credit Default Rate | ~5%–6% (incl. PIK, LMEs, restructurings) | Headline: <2% (per standard definitions) | Record high on adjusted basis | Fitch Ratings / Forbes, May 2026 |
Rate Environment Context: The Fed’s September hike brought the target range to 3.75%–4.00%. The July 2026 SLOOS confirms C&I lending standards for large and middle-market firms are currently easier than their historical midpoints, with banks reporting narrower loan-rate spreads over cost of funds — signaling that, despite the rate environment, banks are actively competing for quality borrowers. This is a material headwind for private credit managers who built business models around bank retrenchment.
Structural Default Divergence: Moody’s estimates that distressed restructurings — debt exchanges and maturity extensions agreed under duress — accounted for roughly 65% of all 2025 private credit defaults. The headline rate of sub-2% substantially understates actual credit deterioration. Proskauer’s Private Credit Default Index, tracking 697 loans totaling $189.2 billion, recorded a 2.73% default rate in Q1 2026 — up from 1.84% just two quarters earlier.
Sector Analysis: Where Capital Is Flowing — and Where It Is Retreating
🔴 Healthcare: Volume Leader, Default Concern
Healthcare led all sectors for private credit in 2025, accounting for 19% of all direct lending deals — and was the only industry to not see significant year-over-year price tightening, with spreads landing at an average of approximately SOFR+500 bps in Q4 2025. However, lenders are now wrestling with the sector’s deteriorating credit profile. Healthcare was the only sector with “elevated” defaults measured both by count (4.2%) and on a size-weighted basis (2.7%), per Houlihan Lokey’s analysis. Lenders should distinguish between non-cyclical services (physician management groups, diagnostics) which retain strong FCCR profiles, and capital-intensive healthcare platforms carrying aggressive acquisition debt from 2021–2022 vintages.
🔴 Software / SaaS: Repriced, Not Resolved
Software and technology credits continue to price 50–100 bps wider than broader market levels, reflecting ongoing lender caution despite competitive demand for high-quality issuers. The Q1 2026 AI-disruption selloff sent secondary B-rated software loan spreads to approximately 200 bps wider than year-end levels. Yet the actual default data is more nuanced: software borrowers posted “among the lowest default rates of any industry,” with valuations described as “conservative” following first-half 2026 scrutiny triggered by fears of AI disruption. New issuance in the software sector has remained limited through Q3 2026, and lenders continue to demand above-market premiums, creating a bifurcation between legacy portfolio stress and new-vintage discipline.
🟢 Infrastructure, Asset-Based Finance & Data Infrastructure: The Growth Engine
The most significant structural shift in 2026 is the rapid reallocation of private credit capital toward asset-backed finance (ABF). Episodes of high volatility are leading private credit to take on a larger percentage of overall lending activity, with expanding opportunities in asset-based financing and high-grade corporate credit. Survey respondents identify senior direct lending, asset-based finance, and specialty finance as the most attractive segments today. The market for asset-based finance is viewed as a $28 trillion addressable market, spanning mortgages, corporate and consumer loans, and equipment finance. Data center financing has emerged as a bellwether: Wellington’s analysis of PitchBook data identified 330 data-center financing transactions from January 2024 through June 2026, with private credit representing approximately one-quarter of activity.
🟠 Industrials & Manufacturing: Rising Stress
The industrials and manufacturing sector posted the highest default rates among the largest sectors, per Fitch. Tariff-related input cost pressures and weakening global demand are compressing EBITDA margins for leveraged issuers, particularly those underwritten to optimistic 2021–2022 growth assumptions. Lenders are tightening covenants and requiring higher equity contributions on new transactions in tariff-exposed sub-sectors.
KPI Underwriting Shift: FCCR & Leverage Under Active Revision
Through June 2026, competitive dynamics have supported leverage levels often in the 5.0x–6.0x range for high-quality transactions, although underwriting standards have become more conservative since March amid expectations for higher base rates and constrained M&A volumes. The FCCR deterioration on legacy books is stark: by Q3 2024, interest expense for early 2022 vintages had increased by approximately 40%, contributing to a decline in average interest coverage from approximately 2.2x at underwriting to the mid-1.5x range. On the positive side, borrower debt/EBITDA ratios have been stable on new deals, with no material upward drift — suggesting lenders have maintained underwriting discipline on borrower leverage over the last three years. Experienced managers are stress-testing forward FCCR to a minimum of 1.2x under a +100 bps rate shock scenario before approving new commitments.
Strategic & Operational Implications
For Borrowers & Operating Executives
- All-in cost of capital is structurally higher. With SOFR at ~3.88% and unitranche spreads at SOFR+475–575 bps, a middle-market borrower accessing new debt today faces all-in coupons of approximately 8.6%–9.6% — requiring EBITDA margins and revenue durability that simply weren’t necessary in 2020–2021. Operators must stress-test free cash flow under this cost structure before pursuing leveraged transactions.
- Covenant documentation is tightening. The most durable lender advantage may come from better documentation, more conservative leverage, and the time to conduct stress analysis before capital is deployed. Borrowers who assumed covenant-lite terms would persist should reassess — particularly at smaller deal sizes where maintenance covenants are increasingly standard.
- Sector matters more than it used to. Lenders are applying material spread premiums (50–200 bps) to software, healthcare rollups, and tariff-exposed industrials. Borrowers in these sectors should budget accordingly and prioritize lender relationships with sector-specific expertise.
For Institutional Investors & Lenders
- Vintage scrutiny is non-negotiable. Credit risk remains most pronounced in 2021–2022 vintages, which were underwritten at historically low reference rates and often incorporated more aggressive growth assumptions, peak leverage, and elevated loan-to-value ratios. Portfolio reviews should prioritize coverage analysis on these cohorts.
- BDC liquidity is a system risk. Most non-traded BDCs reported redemptions above their 5% quarterly limits through Q2 2026, and publicly traded BDCs continue to trade at discounts to reported NAV of 10%–20%. Institutional allocators should evaluate whether NAV marks reflect actual mark-to-market conditions, particularly for software and healthcare-concentrated vehicles.
- The illiquidity premium is compressing. In 2019, private credit offered approximately 350 bps of spread over public high yield for comparable risk; today, that spread has compressed to approximately 150–200 bps. The investment case remains constructive, but the margin of safety is narrower, and fees must be evaluated rigorously against net returns.
- ABF and specialty finance represent the structural opportunity. Alternative asset managers are expanding origination channels and targeting more diverse assets, especially consumer loans and data-infrastructure credit, amid constrained bank lending. Allocators seeking to preserve yield while reducing corporate credit concentration should evaluate dedicated ABF mandates.
Forward-Looking View: Next 3–6 Months
The macro backdrop for the remainder of 2026 and into early 2027 is decidedly “higher for longer.” Futures markets are pricing the effective funds rate to approximately 4.1% by January 2027 and ~4.7% by October 2027, signaling that the rate relief narrative that supported 2024–2025 refinancing activity is substantially exhausted. Markets are currently pricing one to two additional 25 bp rate increases by year-end 2026, and additional increases are expected for the first half of 2027.
For the credit markets, this translates into three near-term dynamics:
- Refinancing risk will intensify. Refinancing risk continues to increase as maturities approach for loans originated during 2021 and 2022, with elevated defaults, restructurings, and amendment activity among these vintages, particularly within healthcare, software, and technology-related investments.
- Spreads are likely to stabilize or widen modestly. With private debt issuance already down ~24.6% YoY through May 2026, and BDC redemption pressure ongoing, supply-demand dynamics are complex. With private credit loan supply expected to increase alongside M&A recovery, PitchBook projects spreads will stabilize or widen — rewarding patient lenders who maintained discipline during the compression cycle.
- Asset-based finance will accelerate. ABF is becoming the primary growth engine as alternative asset managers expand origination channels and target more diverse assets including consumer loans and data-infrastructure credit. Capital raised for private credit secondaries increased more than 14x between 2023 and 2025 per PitchBook, and this liquidity infrastructure will support sector rotation away from stressed corporate credit into collateral-backed structures.
Equity contributions in leveraged buyouts stood at approximately 49% in 2025 versus 33% in 2007 — supporting the view that credit may be structurally safer today than in prior cycles. However, that structural buffer does not eliminate idiosyncratic vintage risk, and the next 18 months will separate managers whose underwriting held from those whose optimism proved costly.
📍 Key Market Insights for Q4 2026
- SOFR at 3.88% and climbing — With futures pricing ~4.7% by late 2027, floating-rate borrowers on legacy deals face sustained interest coverage compression. Any portfolio company with Debt/EBITDA above 5.5x and FCCR below 1.5x warrants active monitoring and restructuring contingency planning now.
- The illiquidity premium has narrowed to 150–200 bps over high yield — down from 350 bps in 2019. Net-of-fee returns in vanilla large-cap direct lending must be rigorously benchmarked against publicly traded alternatives before new institutional commitments are made.
- Lower middle market ($5M–$25M EBITDA) offers the most durable spread premium — with a 232 bps premium over large-cap as of Q3 2025, real maintenance covenants, and deal flow driven by baby boomer succession dynamics that are structurally insulated from institutional capital crowding.
- Asset-based finance is the asset class’s most important structural growth driver — with a $28 trillion addressable market, growing bank-private credit partnerships, and compelling economics for insurance and pension investors seeking long-duration, collateral-backed yield. Allocators without an ABF allocation are underweight the sector’s future center of gravity.
- Default statistics require forensic interpretation — the headline rate of sub-2% substantially understates stress when PIK conversions, maturity extensions, and LMEs are included. Fitch’s adjusted rate of ~6% and Proskauer’s 2.73% tracked default rate (Q1 2026) represent the more operationally meaningful signal for portfolio risk management and lender underwriting.


