
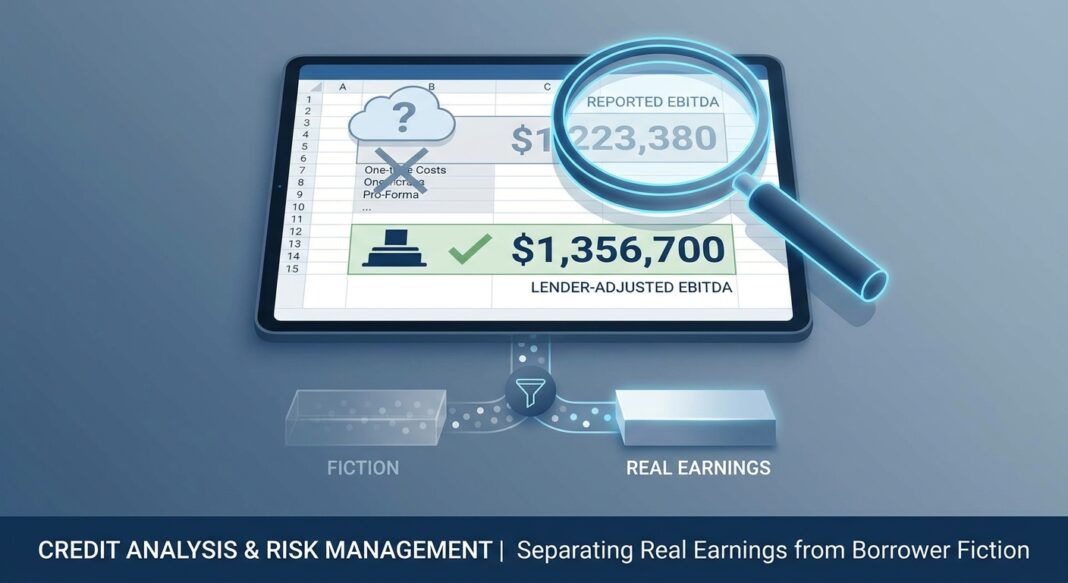
Underwriting & Risk Management | Credit Analysis
October 5, 2026 • Bond Capital Editorial Desk
The $3 Million Question Every Credit Officer Must Answer
A middle-market borrower presents a Confidential Information Memorandum. The cover page announces $12.4 million in Adjusted EBITDA. The proposed leverage is 4.5x. The deal looks passable. Then the underwriter opens the add-back schedule.
Line items include: $1.1 million in “one-time” ERP implementation costs (this is the third year in a row they appear), $600,000 for a lawsuit settlement that management describes as non-recurring, $400,000 in stock-based compensation, and $900,000 in pro forma savings from a cost restructuring program that has not yet been implemented. Total proposed add-backs: $3.0 million. Strip them out, and reported EBITDA is $9.4 million — putting real leverage at 5.9x, not 4.5x.
This scenario plays out across private credit and leveraged lending markets every day. The job of the credit underwriter is not to accept the borrower’s earnings narrative. It is to build an independent, documented, and defensible earnings figure that predicts actual debt repayment capacity. That process — EBITDA adjustment and normalization — is one of the most consequential analytical disciplines in credit underwriting.
Getting it wrong does not just affect one deal. Academic research from the University of Houston found that each additional non-GAAP add-back lowers a borrower’s Z-score by 1.469 and increases the probability of a ratings downgrade by 37.5% in the three-year period following loan origination — a finding that quantifies what experienced credit officers already know intuitively: aggressive add-backs are a leading indicator of future credit deterioration.
The Analytical Framework: Three Layers of EBITDA
Institutional credit practitioners distinguish between three distinct earnings figures, each serving a different analytical purpose:
- Reported EBITDA: The GAAP-based figure from audited or reviewed financial statements. This is the starting point, not the answer.
- Borrower-Adjusted (Normalized) EBITDA: The figure management presents after applying its proposed add-backs. This reflects management’s best case for what recurring earnings look like.
- Lender-Adjusted EBITDA: The figure the credit team independently underwrites after subjecting each proposed adjustment to rigorous scrutiny. This is the number that drives debt capacity analysis.
Best-in-class credit documentation presents all three, with a transparent bridge between them. As practitioners note, the cleanest credit memo shows both borrower-adjusted EBITDA and lender-adjusted EBITDA, with a clear bridge between them — preserving transparency for approvers, examiners, portfolio managers, and future renewal teams.
The CARVE Test: A Practitioner’s Screening Tool
A practical methodology for evaluating individual add-backs is the CARVE framework, which requires each adjustment to be:
- C — Cash-impact confirmed: The adjustment reflects an actual cash expense, not an accounting reclassification.
- A — Auditable: Objective documentary evidence exists — not just a borrower narrative or management memo.
- R — Recurring-absence verified: A review of at least 24–36 months of general ledger detail confirms the item does not repeat.
- V — Verifiable by third party: The amount can be confirmed by invoices, contracts, payroll registers, or court filings.
- E — Excluded from operations: The cost is not needed to generate revenue, serve customers, or maintain the asset base.
An add-back that fails two or more CARVE criteria should be haircut or excluded entirely — regardless of how it is presented in the borrower’s information package.
Worked Example: $10M EBITDA Manufacturing Borrower
Consider a manufacturing company presenting the following adjustment schedule:
| Item | Borrower Add-Back | Lender Treatment | CARVE Failures |
|---|---|---|---|
| Reported EBITDA | $8,500,000 | $8,500,000 | — |
| Owner excess compensation (vs. market CEO) | +$385,000 | +$385,000 | None — accepted with compensation benchmark |
| Related-party rent normalization | +$120,000 | +$120,000 | None — accepted with CoStar comparable |
| “One-time” ERP costs (3rd consecutive year) | +$1,100,000 | $0 | Fails R (recurring), fails E (operational) |
| Litigation settlement | +$600,000 | +$300,000 | Partial — haircut 50% given unresolved related claims |
| Stock-based compensation | +$400,000 | $0 | Fails E — genuine compensation cost |
| Pro forma restructuring savings (unimplemented) | +$900,000 | $0 | Fails A, V, R — forward-looking, not historical |
| Lender-Adjusted EBITDA | $12,005,000 | $9,305,000 | — |
The borrower claims $12.0M; the lender underwrites $9.3M. The delta is $2.7M — enough to move leverage from 4.5x to 5.8x on a $42M debt load. This is not a rounding error. It is the difference between a credit approval and a decline.
From Normalized EBITDA to Debt Capacity: The Coverage Cascade
Once lender-adjusted EBITDA is established, the underwriter builds a coverage cascade to stress-test debt capacity across three scenarios.
Key Metrics and Calculations
| Metric | Formula | Base Case | Stress −15% | Stress −25% |
|---|---|---|---|---|
| Lender-Adjusted EBITDA | — | $9,305,000 | $7,909,000 | $6,979,000 |
| Less: CapEx (maintenance) | — | ($800,000) | ($800,000) | ($800,000) |
| Less: Cash Taxes | — | ($650,000) | ($553,000) | ($489,000) |
| Less: Annual Debt Service | — | ($4,200,000) | ($4,200,000) | ($4,200,000) |
| Free Cash Flow After Debt Service | — | $3,655,000 | $2,356,000 | $1,490,000 |
| Total Leverage (Debt/EBITDA) | Debt ÷ EBITDA | 4.5x | 5.3x | 6.0x |
| Debt Service Coverage Ratio | EBITDA ÷ Debt Service | 2.22x | 1.88x | 1.66x |
| Fixed Charge Coverage Ratio | (EBITDA − CapEx − Taxes) ÷ Debt Service | 1.87x | 1.56x | 1.35x |
The stress analysis reveals that even a 25% EBITDA decline leaves this borrower with positive free cash flow and an FCCR above 1.0x — a reasonable credit. Had the team underwritten to the borrower’s $12.0M figure, the −25% scenario would produce leverage above 6.4x and an FCCR of 1.05x — a credit on the edge of covenant breach. Note that a DSCR shift from 1.15x to 1.35x — driven by just $200,000 in accepted add-backs — can move a credit from decline to approval. The evidence standard must match the stakes.
Underwriters should also test the EBITDA-to-FCF conversion rate. A borrower with high working capital requirements, deferred maintenance, or rising capex intensity may report strong EBITDA but generate weak cash flow. A conversion rate below 60% warrants close examination of capital efficiency and cash management practices.
What Institutional Lenders Require: Standards, Red Flags, and Market Data
What Experienced Lenders Look For
Institutional credit standards hold that normalized EBITDA reflects what the business did earn on a representative historical basis — not what it could earn under future ownership. When a seller’s adjustment schedule blends historical normalization with forward-looking pro forma items, the two must be separated and evaluated independently. The price is set on history.
Many PE buyers specifically exclude stock-based compensation from debt capacity calculations because lenders underwriting leverage ratios should not extend credit against earnings inflated by adding back genuine compensation costs. An inflated normalized EBITDA that lenders reject in their own underwriting does not support the debt capacity needed to achieve target returns — and forces either a price reduction or a deal that never closes.
Across buy-side and sell-side engagements, it is common for 10 to 30 percent of proposed add-backs to be disallowed during independent QoE review — with the proportion rising further on aggressive sell-side memoranda. This disallowance rate is not a negotiating posture; it reflects systematic documentation failures and a tendency by sellers to label recurring costs as non-recurring.
Common Red Flags in Borrower EBITDA Schedules
- “One-time” costs that appear in multiple periods: A legal expense recurring in three consecutive years is a structural cost, not an anomaly. Underwriters should pull 36 months of general ledger detail to surface these patterns.
- Revenue-side adjustments: Adjusting EBITDA upward for “lost revenue” — from contract delays, weather, or operational disruptions — deserves heightened scrutiny. Revenue is a forecast; it is not auditable in the same way an expense is.
- Unimplemented pro forma savings: Adding back future synergies or restructuring benefits that have not been implemented adds future value to a historical number. In the worst cases, these are speculative cost cuts that may never materialize.
- Deferred maintenance normalization: Companies that have reduced fleet replacement or delayed facility repairs to boost near-term EBITDA require a downward adjustment for normalized maintenance capex — not an add-back.
- ERTC and government program credits: One-time government credits recorded as payroll expense reductions inflated EBITDA in the periods they were recognized. Since they will not recur, a buyer normalizes them out — which reduces adjusted EBITDA. Honest, bidirectional adjustments build lender credibility.
- Owner-key-person concentration: Where significant revenues are tied to relationships not contractually secured or transitioned to a retained management team, associated revenues carry elevated retention risk and may warrant a revenue haircut.
📊 Credit Performance Data Box
- Leveraged Loan Default Rate (U.S., LTM June 2026): 1.34% per Invesco / Morningstar LSEG data — significantly improved from the 7.1% Moody’s peak reached in September 2024.
- First-Lien Senior Secured Recovery Rate (long-term average): 70–80 cents on the dollar per Moody’s ultimate recovery data; recent expected recoveries have drifted toward 60–70% due to loan-only capital structures, covenant-lite documentation, and liability management exercises (LMEs) that can subordinate non-participating lenders.
- Moody’s 2024 expected first-lien recovery: Approximately 57.6% across all sectors in North America and Europe — below the long-term average of 65.0% — with structural deterioration and flexible credit documentation cited as contributing factors.
- EBITDA add-back credit risk signal: University of Houston research found each additional non-GAAP add-back raises the probability of a borrower ratings downgrade by 37.5% over the three-year post-origination period.
- Senior direct lending loss rates: The Senior Cliffwater Direct Lending Index has recorded loss rates consistently below 1% since inception in 2011 — a testament to first-lien positioning and disciplined underwriting, per StepStone Group analysis.
- Add-back disallowance in QoE: 10–30% of proposed seller add-backs are commonly rejected during independent quality of earnings review; on aggressive sell-side memoranda, the proportion can be materially higher.
EBITDA Normalization: The Credit Underwriting Checklist
Use this step-by-step framework during initial diligence and prior to credit committee submission:
✅ Step 1 — Anchor to Audited Financials
- Obtain three full years of audited (or reviewed) financial statements plus the most recent interim period.
- Tie reported EBITDA to the general ledger and bank statements — not to management-prepared summaries.
- Identify revenue recognition policies: percentage-of-completion, deferred revenue, and cut-off issues can shift earnings materially between periods.
✅ Step 2 — Build the Add-Back Bridge (CARVE Each Line)
- Request a line-item add-back schedule with documentation for every proposed adjustment.
- Apply the CARVE test to each item: Cash, Auditable, Recurring-absence verified (24–36 months), Verifiable, Excluded from operations.
- Separate historical normalization from implemented run-rate items from prospective improvements — and underwrite each category with appropriate skepticism.
- Require third-party documentation: compensation benchmarks, CoStar comparables for related-party rent, court filings for litigation settlements.
✅ Step 3 — Apply Independent Haircuts
- Haircut or exclude any add-back that fails two or more CARVE criteria.
- Apply a 50–80% haircut to pro forma items per standard buyer underwriting practice.
- Exclude stock-based compensation from debt capacity calculations (maintain as an expense).
- Review for bidirectional adjustments: ERTC credits, insurance proceeds, and non-recurring gains must be subtracted, not ignored.
✅ Step 4 — Stress Test the Coverage Cascade
- Run base case, −15%, and −25% EBITDA scenarios.
- Calculate Total Leverage (Debt/EBITDA), DSCR (EBITDA ÷ Debt Service), and FCCR ((EBITDA − CapEx − Taxes) ÷ Debt Service) across all scenarios.
- Flag any scenario where leverage exceeds 6.0x or FCCR falls below 1.10x as requiring additional structural protection or deal resizing.
- Calculate EBITDA-to-FCF conversion; investigate any ratio below 60%.
✅ Step 5 — Document and Present the Bridge
- Present both borrower-adjusted and lender-adjusted EBITDA in the credit memo, with a labeled bridge between them.
- Note any adjustments the borrower proposed that were rejected, with the reason documented.
- Flag owner/key-person concentration risk and any revenue streams not contractually secured through a transition period.
- For any add-back exceeding 15% of reported EBITDA, require a Quality of Earnings report from a recognized accounting firm before credit committee submission.
Key Takeaways for Credit Practitioners
- 🎯 Lender-adjusted EBITDA is not the borrower’s adjusted EBITDA. Build an independent bridge and document every deviation. The gap between borrower and lender EBITDA often tells you more about credit risk than the headline number itself.
- ⚠️ Non-GAAP add-backs are a quantifiable credit risk signal. Academic research shows each additional add-back is associated with a 37.5% higher probability of ratings downgrade in the three years post-origination. Treat a long add-back schedule as a diligence flag, not a convenience.
- 📊 Apply the CARVE test to every line item. An adjustment must be Cash-confirmed, Auditable, Recurring-absence verified over 24–36 months, Verifiable by third party, and Excluded from operations. Failure on two or more criteria warrants exclusion or a material haircut.
- 🔧 Stress test matters as much as the base case. The relevant question is not whether debt can be serviced in a base scenario — it is whether coverage ratios hold at a 25% EBITDA decline. A credit that breaks at −15% requires structural protection: tighter covenants, a smaller loan, or enhanced collateral.
- 🛡️ Structural position remains the last line of defense. First-lien senior secured loans have historically recovered 70–80 cents on the dollar; recent recoveries have drifted toward 60–70% due to covenant erosion and LMEs. Strong underwriting reduces default probability; senior secured positioning limits loss severity when defaults occur. Both disciplines are required.


