
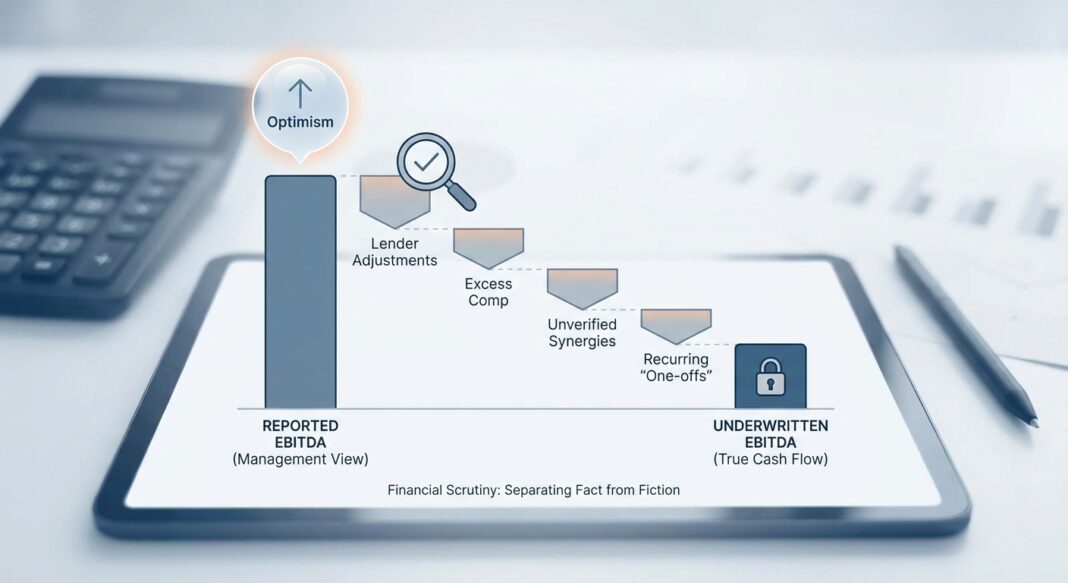
EBITDA Adjustments and Normalization: The Underwriter’s Framework for Separating True Cash Flow from Management’s Optimism
When a borrower presents $12M of adjusted EBITDA, the credit question is not whether the number is real — it is whether the lender’s version of that number is defensible. How you normalize EBITDA determines your leverage ratio, your covenant cushion, and ultimately, your loss severity in a downside scenario.
The Underwriting Challenge
Every credit presentation arrives with a number: Adjusted EBITDA. It sits in the top left of every deal summary, drives the leverage multiple, and anchors nearly every financial covenant in the credit agreement. It is also the most frequently manipulated figure in leveraged finance.
The challenge for any underwriter is fundamental: management-adjusted EBITDA reflects the seller’s or borrower’s best-case normalization of earnings. The lender’s job is to reconstruct that figure independently, from the ground up, and arrive at a number they are willing to lend against — not the number they were handed.
This discipline matters more today than at any point in the past decade. As private credit has scaled aggressively, covenant structures have eroded and add-back definitions have expanded, creating meaningful information asymmetry between borrower and lender. The underwriter who accepts the sponsor’s adjusted EBITDA uncritically is underwriting to a fiction. The one who builds their own bridge — line by line — is doing credit work.
This article provides a practitioner-grade framework for EBITDA normalization in credit underwriting: how to construct the adjustment bridge, which add-backs to challenge, how normalization errors flow directly into leverage and DSCR calculations, and what the credit performance data tells us about the cost of getting it wrong.
The Analytical Framework: Building a Lender-Grade EBITDA Bridge
The goal of EBITDA normalization in credit underwriting is narrow and precise: to determine the sustainable, recurring, cash-generative earnings power of the business as it will exist under the proposed capital structure — not as it existed under prior ownership, not with speculative synergies embedded, and not with questionable items dressed as one-time charges.
A rigorous framework begins with reported EBITDA from audited or reviewed financials and builds a bridge through three tiers of adjustment:
Tier 1 — Accepted Normalization Adjustments
These are adjustments that institutional lenders routinely accept because they are well-documented, non-recurring, and clearly outside the ordinary course of operations. They include: verified one-time legal or litigation settlements, documented facility closure costs, one-time transaction advisory fees, and genuine non-cash charges such as asset impairments or mark-to-market losses on financial instruments that will not recur under the new structure.
Tier 2 — Adjustments Requiring Haircut or Verification
These require independent confirmation before any credit is given. Owner and executive compensation normalization is the most common example: in a closely held business, owner pay is frequently set at a level that reflects personal tax planning rather than market-rate compensation for the role. The adjustment — upward or downward — must be benchmarked against third-party compensation data, not accepted at face value. Similarly, related-party lease arrangements, personal expenses run through the business, and discretionary items require market-rate normalization with documentary support.
Tier 3 — Adjustments the Lender Rejects
These are add-backs that sophisticated lenders remove entirely from their underwritten EBITDA. They include vague or undocumented “synergy” projections that have not been achieved, recurring costs labeled as non-recurring (restructuring charges appearing in three or more consecutive periods are by definition recurring), revenue-side adjustments that assume sales the business has not yet won, and future cost savings from actions not yet implemented.
The CARVE Test
A disciplined way to evaluate any proposed add-back is to apply the CARVE test: Is the adjustment Cash-impacting? Is it Auditable with documentary evidence? Is it truly Removed from recurring operations? Is it Verifiable by an independent party? And is it genuinely Excluded from the ongoing cost structure? An adjustment that fails any one of these criteria warrants significant skepticism.
The output of this process is two distinct numbers: borrower-adjusted EBITDA and lender-adjusted EBITDA. Both should appear in the credit memorandum with a clear, line-by-line bridge between them. This transparency matters not only for credit committee approval, but for portfolio monitoring, covenant compliance, and any future workouts.
Walking Through the Calculations: A $10M EBITDA Manufacturing Company
Consider a middle-market industrial manufacturer presenting the following in its CIM:
Borrower’s Presented Adjusted EBITDA Bridge
| Item | Amount | Lender Assessment |
|---|---|---|
| Reported EBITDA (LTM) | $8,200,000 | Accepted — from audited financials |
| Add: Owner excess compensation | $600,000 | Partial credit — benchmarked to $400K market rate; accept $200K delta |
| Add: One-time legal settlement | $450,000 | Accepted — documented, non-recurring, fully paid |
| Add: “Restructuring costs” | $520,000 | Rejected — present in 3 of last 4 years; recurring cost |
| Add: Revenue synergy (pipeline deals not closed) | $750,000 | Rejected — speculative, zero evidentiary support |
| Add: ERP system implementation | $280,000 | Accepted — documented one-time capital project cost |
| Borrower Adjusted EBITDA | $10,800,000 | |
| Lender Underwritten EBITDA | $9,130,000 | After removing $1,270K in unsupported add-backs and haircut on comp |
The $1.67M gap between borrower and lender EBITDA is not a rounding error — it is a structural difference in credit underwriting. At a proposed total debt of $43M, the borrower presents leverage of 3.98x. The lender’s underwritten leverage is 4.71x — a meaningful difference in both covenant headroom and risk profile.
How Normalization Errors Cascade into DSCR
Assume the same deal carries $3.8M in annual debt service (principal and interest at current rates). On the borrower’s number, DSCR is 2.84x — well within comfort. On the lender’s underwritten EBITDA (before capex and working capital), DSCR falls to 2.40x — still serviceable, but stress-testing with a 15% EBITDA haircut (a standard cyclical stress) brings that ratio to 2.04x. If the $1.27M in rejected add-backs had been accepted, that same stress scenario would have produced a DSCR of 2.40x, giving the lender false confidence heading into any cyclical pressure.
This is the hidden leverage in EBITDA manipulation: overstatement doesn’t just inflate the entry multiple, it compresses the perceived distance to covenant breach and masks deteriorating credit quality before it surfaces in payment default.
Industry Standards, Red Flags, and Credit Performance Data
What Institutional Lenders Require
Experienced institutional lenders evaluate EBITDA normalization with a clear hierarchy of evidence. The most credible add-backs are those supported by audited financials, third-party invoices, or executed contracts. Management representations alone — without documentary support — are routinely discounted or removed entirely. The cleanest credit presentation shows both borrower-adjusted EBITDA and lender-adjusted EBITDA with a clear, reconcilable bridge between them, preserving transparency for approvers, examiners, and future renewal teams.
On leverage, current market standards in private credit show meaningful stratification by deal size. According to PGIM’s mid-2025 survey data, upper middle-market buyouts typically secure financing at 5.0x–5.5x EBITDA, while lower middle-market transactions generally range between 3.5x–4.5x EBITDA. Private credit lenders have maintained firmer covenant positions than the broadly syndicated market, where approximately 90% of new loans in 2024 remained covenant-lite.
On coverage, most commercial and middle-market lenders set a minimum DSCR covenant floor of 1.25x, with a strong preference for ratios approaching 2.0x for cyclical or operationally complex borrowers. Covenant design that aligns with the borrower’s actual business model — rather than applying a formulaic ratio — produces more durable monitoring outcomes.
The Cost of Getting EBITDA Wrong: Credit Performance Data
Key Credit Performance Benchmarks (2024–2025)
- Global speculative-grade default rate: The trailing 12-month speculative-grade default rate reached 4.4% as of June 2025, with S&P reporting speculative-grade default rates above 4% continuing into late 2025. S&P forecasts a decline to approximately 4.0% by September 2026. (Source: S&P Global Ratings; coinlaw.io aggregation of agency data, 2026)
- Distressed exchanges dominating default mix: Moody’s Ratings reported that distressed exchanges — debt restructurings done under financial duress — accounted for 64% of all defaults in H1 2025, approximately the same pace as all of 2024. This reflects a market where borrowers are extending and modifying debt terms before formal default, often at lender expense. (Source: Moody’s Ratings, July 2025 US Credit Review & Outlook)
- First-lien recovery rates declining: Moody’s has estimated expected ultimate recoveries on US first-lien senior secured loans at approximately 68%, versus long-run historical experience in the high 70s. First-lien loans in covenant-lite structures are estimated to recover approximately 50%, compared to 65% for first-lien structures with maintenance covenants — a 15-percentage-point penalty for weaker documentation. (Source: Moody’s Ultimate Recovery Database; bancalliance.com analysis)
- Covenant maintenance and recovery correlation: Median recovery rates are 84.1% for loans with maintenance covenants versus 63.5% for those without — a 20-point spread that represents the economic value of credit discipline embedded in the structure. (Source: Moody’s, as cited in BancAlliance analysis)
- Middle-market refinancing pressure: Middle-market corporate debt issuance in the U.S. fell approximately 16% year-over-year in Q2 2025, limiting refinancing options for at-risk firms and increasing the credit significance of accurate cash flow underwriting at origination. (Source: coinlaw.io aggregation of agency and market data, 2026)
Red Flags in EBITDA Presentations
Experienced underwriters watch for a consistent set of warning signs. Restructuring charges that appear in multiple consecutive periods but are described as “non-recurring” represent the most common form of EBITDA inflation in middle-market deals. Stock-based compensation removed from EBITDA without disclosure can inflate normalized earnings by 10–20% at high-SBC technology companies. Revenue-side adjustments — projecting contracts not yet signed or price increases not yet implemented — deserve the highest level of skepticism and should almost never receive credit in a conservative underwriting. Finally, any borrower whose explained adjustments are inconsistent across the CIM, management presentation, and financial model has a credibility problem that extends beyond EBITDA normalization.
EBITDA Normalization Underwriting Checklist
Step 1 — Source Financial Data Independently
- Obtain three years of audited or reviewed financial statements directly from the auditor or borrower, not from the CIM appendix
- Request federal tax returns (Forms 1120 or 1065) to cross-reference reported income against filed positions
- Pull trailing twelve-month (LTM) management accounts and reconcile to the last audited period
- Review bank statements for at least 12 months to verify cash flows independently of P&L presentation
Step 2 — Build the Lender’s EBITDA Bridge
- Start from reported EBITDA, not adjusted EBITDA — work forward, not backward from a target number
- Apply the CARVE test to every proposed add-back: Cash-impacting, Auditable, Recurring (absence of), Verifiable, Excluded from operations
- Benchmark owner/executive compensation to third-party market data; do not accept borrower’s characterization of “excess” without independent comp study
- Identify all related-party transactions (leases, management fees, intercompany loans) and normalize to market economics
- Flag any add-back that has appeared in more than two consecutive reporting periods for rejection as recurring cost
- Separate management’s adjustments into three buckets: historical normalization (defensible), implemented run-rate (partial credit), prospective improvement (reject or model as upside only)
Step 3 — Calculate and Stress-Test Core Metrics
- Compute Total Debt / Lender EBITDA and Senior Debt / Lender EBITDA at closing leverage
- Calculate DSCR = Lender EBITDA / Total Debt Service (interest + scheduled principal); confirm minimum 1.25x covenant floor is met on underwritten, not borrower-adjusted, earnings
- Run a base case (flat EBITDA), a stress case (–15% EBITDA), and a severe case (–25% EBITDA); confirm leverage and DSCR remain within acceptable covenant thresholds in the stress case
- Test covenant headroom: at what EBITDA level does the borrower breach the first financial maintenance covenant? Express as a percentage decline from underwritten EBITDA
Step 4 — Document and Present Both EBITDA Figures
- Include both borrower-adjusted EBITDA and lender-adjusted EBITDA in the credit memo with a fully reconciled bridge
- Note every rejected or haircut add-back with the specific reason for the lender’s decision
- Ensure that covenant definitions in the credit agreement use lender-underwritten EBITDA as the base, with explicit permitted add-back categories and dollar caps where appropriate
- Archive all supporting documentation by add-back category for portfolio monitoring and future renewal teams
Questions to Ask Management
- “Walk me through every add-back item that exceeds $100,000 and tell me what documentation you have.”
- “Have any of these adjustments appeared in prior-year financials? Under what description?”
- “What is the market-rate salary for your role at a company this size? Who determined that figure?”
- “If we remove the projected synergies and run-rate items, what does the business earn today on a trailing basis?”
- “Has your auditor reviewed or commented on these adjustments?”
Key Takeaways
- Always build your own EBITDA bridge. Lender-adjusted EBITDA and borrower-adjusted EBITDA are different numbers. Both must appear in the credit memo with a line-by-line reconciliation. The gap between them is a direct measure of underwriting discipline.
- Recurring costs are not add-backs. Any “one-time” charge that has appeared in two or more consecutive periods is a structural cost of doing business. Accepting it as non-recurring inflates EBITDA, compresses apparent leverage, and creates false covenant headroom.
- EBITDA normalization errors cascade into DSCR and covenant design. A $1M overstatement in a $10M EBITDA deal is not a rounding error — it is a 10% inflation in the denominator of every credit metric the lender uses to monitor the position for the life of the loan.
- Covenant structure and recovery are directly linked. Moody’s data shows median recoveries of 84.1% for loans with maintenance covenants versus 63.5% for covenant-lite structures. Rigorous EBITDA normalization at origination enables tighter, more defensible covenant calibration — and materially better outcomes when credit deteriorates.
- The current credit environment rewards conservative normalization. With speculative-grade default rates above 4% into 2025–2026, distressed exchanges accounting for nearly two-thirds of all defaults, and first-lien recovery rates declining below historical averages, the cost of accepting an inflated EBITDA at entry is no longer theoretical — it is realized loss.


