
The Underwriting Problem Hidden in Plain Sight
Every credit memo begins with a deceptively simple number: EBITDA. But in modern leveraged lending, that number almost never reflects what it claims to reflect. By the time a sponsor or borrower delivers a Confidential Information Memorandum, reported EBITDA has frequently been stretched — through add-backs, pro forma adjustments, synergy credits, and forward-looking cost-savings — into something that bears only a passing resemblance to the cash the business actually generates.
The stakes are direct. EBITDA is the denominator in every leverage ratio used for covenant compliance, credit sizing, and pricing decisions. Aggressive adjustments can mask credit risk because normalized EBITDA is the denominator in leverage ratios used for covenant compliance — and overly aggressive add-backs can make a highly levered company appear to have more headroom than it actually has, obscuring credit deterioration until it is too late.
For a credit underwriter, the ability to reconstruct a defensible, lender-adjusted EBITDA from a borrower’s management schedule is not optional. It is the foundation of every coverage ratio, every leverage covenant, and every debt capacity conclusion in the credit memo. This article builds a rigorous, step-by-step methodology for doing exactly that.
The Analytical Framework: A Four-Layer EBITDA Bridge
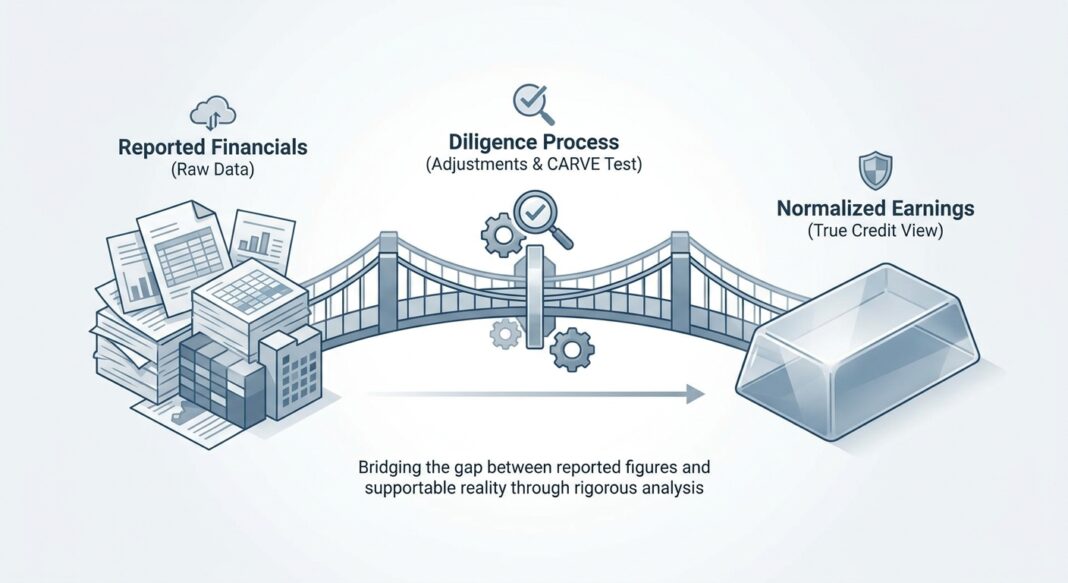
Experienced credit underwriters think of EBITDA not as a single number but as a bridge — a documented walk from reported financials to a lender-supportable earnings base. That bridge has four layers, each with a different evidentiary standard.
Layer 1 — Reported EBITDA
Start with GAAP net income and add back interest expense, income taxes, depreciation, and amortization. This is the audit-verified baseline. No subjectivity exists here, and any credit memo that does not begin at this point has a documentation problem.
Layer 2 — Management-Adjusted EBITDA
Reported EBITDA is the accounting starting point, management-adjusted EBITDA is the seller’s proposed bridge, and normalized EBITDA is the more supportable estimate of sustainable earnings. The management schedule is a starting point, not a conclusion. Every adjustment must be defensible — unsupported or aggressive add-backs are routinely removed during underwriting.
Layer 3 — Lender-Adjusted (Normalized) EBITDA
This is the underwriter’s independent reconstruction. Covenant definitions may permit adjustments that a credit officer still haircuts for underwriting conservatism — and the cleanest credit memo shows both borrower-adjusted EBITDA and lender-adjusted EBITDA, with a clear bridge between them. Lender-adjusted EBITDA applies the CARVE test to every line item: the CARVE test asks whether each add-back is Cash, Auditable, Recurring in its exclusion, Verifiable, and Excluded-from-operations.
Layer 4 — Stress-Case EBITDA
The final layer applies a downside scenario — typically a 15–25% revenue decline or margin compression — to the lender-adjusted base. Debt service coverage must remain above 1.0x in the stress case for most institutional lenders to approve a transaction at full size.
Working Example: $10M EBITDA Manufacturing Company
| Line Item | Borrower Claimed ($000) | Underwriter Decision | Lender Credit ($000) |
|---|---|---|---|
| Reported EBITDA | $7,800 | Accepted — audited | $7,800 |
| One-time legal settlement | +$500 | Accepted — documented, non-recurring | +$500 |
| Owner excess compensation | +$400 | Haircut to $250 — market-rate replacement verified | +$250 |
| “Restructuring” charges (year 3 of 3) | +$600 | Rejected — recurring pattern (3 consecutive years) | $0 |
| Synergy add-back (post-acquisition) | +$700 | Rejected — prospective, unverified | $0 |
| Non-cash stock compensation | +$300 | Accepted — non-cash, auditable | +$300 |
| Adjusted EBITDA | $10,300 (borrower) | — | $8,850 (lender) |
Illustrative example for educational purposes. Numbers are hypothetical.
Walking Through the Calculations: Coverage, Leverage, and Where the Gap Shows Up
The $1,450,000 difference between borrower-claimed EBITDA ($10.3M) and lender-adjusted EBITDA ($8.85M) in the example above is not trivial. Assume a $45M debt structure priced at 7.5%, with annual interest of $3.375M and required amortization of $900K, creating total annual debt service of $4.275M.
Key Metric Calculations
- Leverage (Debt/EBITDA): On borrower EBITDA — 4.37x. On lender EBITDA — 5.08x. A 0.71x delta that may breach a 5.0x maintenance covenant on Day 1.
- Interest Coverage (EBITDA/Interest): Borrower — 3.05x. Lender — 2.62x. The lender-adjusted figure is meaningfully below many institutional minimums of 2.75x–3.0x.
- DSCR (EBITDA/Total Debt Service): A $200,000 add-back difference can be enough to change a DSCR from 1.15x to 1.35x — a gap sufficient to convert a decline into an approval — so the evidence standard should match the impact.
The Recurring Restructuring Red Flag
Treating recurring restructuring or litigation charges as non-recurring is a common mistake — a company with “one-time” restructuring charges in five consecutive years does not have one-time charges, it has a recurring cost structure, and underwriters should challenge any add-back that has appeared in multiple periods.
Normalization vs. Pro Forma: A Critical Distinction
Normalized EBITDA should not be confused with pro forma EBITDA — normalized EBITDA adjusts for non-recurring items, while pro forma EBITDA adjusts for changes in the business (such as a recent acquisition) to show what EBITDA would have been on a combined basis. Buyers are most likely to capitalize supportable historical adjustments, may give partial credit to implemented run-rate changes, and often reserve future improvements for their own upside case. Credit underwriters should apply the same tiered logic.
Industry Standards, Structural Risks, and Credit Performance Data
The EBITDA Add-Back Problem Has Reached Systemic Scale
There is evidence that headline debt-to-EBITDA is understated across leveraged lending — M&A and private equity buyouts routinely include synergies or operational improvements as adjustments to EBITDA used for incurrence covenant compliance, and these add-backs are uncertain in both magnitude and timing, potentially overstating EBITDA and understating leverage. Market estimates indicate that incurrence covenants in current deals are subject to EBITDA adjustments of 15–30%.
Research from the Federal Reserve Bank of St. Louis found that covenants based on customized measures of EBITDA hurt loan performance by worsening lead arrangers’ incentives to monitor borrowers and hampering their ability to take timely corrective actions.
Covenant Erosion Is Amplifying EBITDA Risk
Broader credit risk lurks in borrower-friendly loans originated with loose maintenance covenants or subsequently amended to set maximum leverage thresholds particularly wide relative to actual metrics — compounded by EBITDA calculations for covenant compliance that include various add-backs that can obfuscate a borrower’s true earnings power.
Leverage tests, if present at all, often include extensive cushions allowing borrower EBITDA to drop by 30–40% before triggering a breach, while EBITDA definitions have become heavily adjusted, allowing borrowers wide flexibility through add-backs and projections that effectively dilute or delay lender protections.
Recovery Rates Are Declining — And EBITDA Quality Is Part of Why
The long-term average recovery rate for first-lien bank loans based on trading prices post-default is approximately 65%, while for senior unsecured bonds it is 38%. But those historical averages are under pressure. The average recovery rate for first-lien senior secured bank loans was expected to be 57.6% across all sectors in North America and Europe in 2024 — lower than the long-term average of 65.0% — with weak credit quality, structural deterioration, and flexible credit documentation cited as contributing factors.
Moody’s has connected covenant quality directly to recovery outcomes: Moody’s utilized a mean recovery of 50% for structures with only first-lien debt that is covenant-lite, versus 65% when a first-lien-only structure includes covenants.
📊 Data Box: Credit Performance Benchmarks (2024–2025)
- Private credit default rate (2025, incl. distressed exchanges): Moody’s analysis suggests the private credit default rate in 2025 likely ranged between 1.6% and 4.7%, depending on whether distressed exchanges are included.
- Distressed restructurings as share of defaults: Distressed restructurings accounted for approximately 65% of all defaults in 2025, materially influencing how default risk is measured across private markets.
- Selective defaults vs. conventional defaults: S&P Global found that selective defaults outpaced conventional defaults by a 5:1 ratio in 2024, driven by flexible covenants and payment-in-kind conversions.
- KBRA DLD Direct Lending default rate: The KBRA DLD Direct Lending Index showed a trailing 12-month default rate of 1.8% as of September 2025, mirroring the 1.8% rate reported at the end of 2024.
- First-lien recovery rate (current expected vs. historical): First-lien senior secured loans have historically recovered roughly 70–80 cents on the dollar on an ultimate recovery basis, with Moody’s now estimating expected ultimate recoveries near 68% versus long-run experience in the high 70s.
Sources: Moody’s Analytics, S&P Global Market Intelligence, KBRA DLD Default Index. Data as cited.
The EBITDA Normalization Underwriting Checklist
Use the following diligence framework on every transaction where adjusted EBITDA exceeds reported EBITDA by more than 5%.
- Obtain 3 years of audited financials — Never underwrite to management accounts alone. Trace reported EBITDA from audited P&L statements for each period.
- Build the add-back schedule from scratch — Do not accept the borrower’s schedule as a starting point. Build independently and then compare. The cleanest credit memo shows both borrower-adjusted EBITDA and lender-adjusted EBITDA, with a clear bridge between them, preserving transparency for approvers, examiners, portfolio managers, and future renewal teams.
- Apply the CARVE test to every line:
- C — Cash: Does the add-back represent real cash savings or a genuine non-cash charge?
- A — Auditable: Can it be traced to a specific invoice, severance agreement, or legal settlement?
- R — Recurring exclusion: Is the expense genuinely non-recurring, or does it reappear across periods?
- V — Verifiable: Can third-party documentation support the amount?
- E — Excluded from operations: Is this truly outside normal operating cost structure?
- Normalize owner compensation to market rate — In closely held businesses, owner compensation may be set lower or higher than the company would pay an unrelated third-party executive — the amount paid compared to market rate should be determined and accounted for in the normalized EBITDA calculation.
- Reject or haircut synergy add-backs — Synergies belong to the acquirer, not the target. A target’s normalized EBITDA should reflect standalone economics; synergies are an acquirer-specific adjustment applied on top of the normalized base.
- Check for related-party distortions in both directions — If the business benefits from under-market rent paid to a related party, or if owner labor is underpaid relative to a market replacement, a credible adjusted EBITDA schedule includes both addbacks and adddowns, not only the addback side.
- Run the stress case — Apply a 15–25% EBITDA haircut to lender-adjusted EBITDA. Does leverage remain below the covenant threshold? Does DSCR hold above 1.0x? If not, reprice, resize, or decline.
- Document the covenant EBITDA definition separately — The definition of EBITDA for covenant compliance purposes may differ from underwriting EBITDA. A typical leverage covenant in a direct lending transaction may be set with a 25–35% cushion to the EBITDA projected in a sponsor or borrower model delivered to the lender prior to closing.
Key Takeaways for Credit Underwriters
- Every dollar of EBITDA add-back is a hypothesis, not a fact. Build your own bridge from audited financials and challenge every proposed adjustment against the CARVE test before accepting any credit into your model.
- The EBITDA gap between borrower and lender can reverse an approval. A $1.45M difference on a $10M EBITDA business can move leverage from 4.37x to 5.08x — enough to breach a maintenance covenant or disqualify a transaction under institutional lending policy.
- Recurring charges labeled "one-time" are a primary red flag. Three or more years of restructuring or integration costs in an add-back schedule is a structural cost problem, not an exception. Reject the add-back, not just haircut it.
- Covenant quality is directly linked to recovery outcomes. Moody’s data shows that covenant-lite structures carry materially lower expected recoveries (approximately 50%) versus covenanted structures (approximately 65%) — making a robust EBITDA definition in loan documentation a first-lien recovery risk issue, not just a reporting preference.
- Transparency in the credit memo protects the entire credit lifecycle. Showing both borrower EBITDA and lender EBITDA — with a documented bridge — is not a formality. It is the record that protects the institution during examinations, annual reviews, amendments, and workouts.


