
The Single-Tranche Revolution Reshaping Middle-Market Finance
Walk into almost any middle-market leveraged buyout today and you will find a unitranche loan sitting at the centre of the capital structure. Once a niche instrument pioneered by specialist direct lenders, the unitranche has become the default financing tool for sponsor-backed transactions between roughly $25 million and $300 million in enterprise value. According to Valuation Research Corporation’s Q2 2026 Private Markets Update, unitranche structures continue to dominate new issuance, with coupon spreads generally ranging from 4.75% to 5.50%. Yet despite their prevalence, the internal mechanics of how these loans actually work, particularly the division between first-out and last-out lenders, remain poorly understood by both the investors who fund them and the operators who borrow under them. This article unpacks those mechanics, grounds them in current market data, and provides a practical decision framework for both audiences.
What Is a Unitranche Loan?
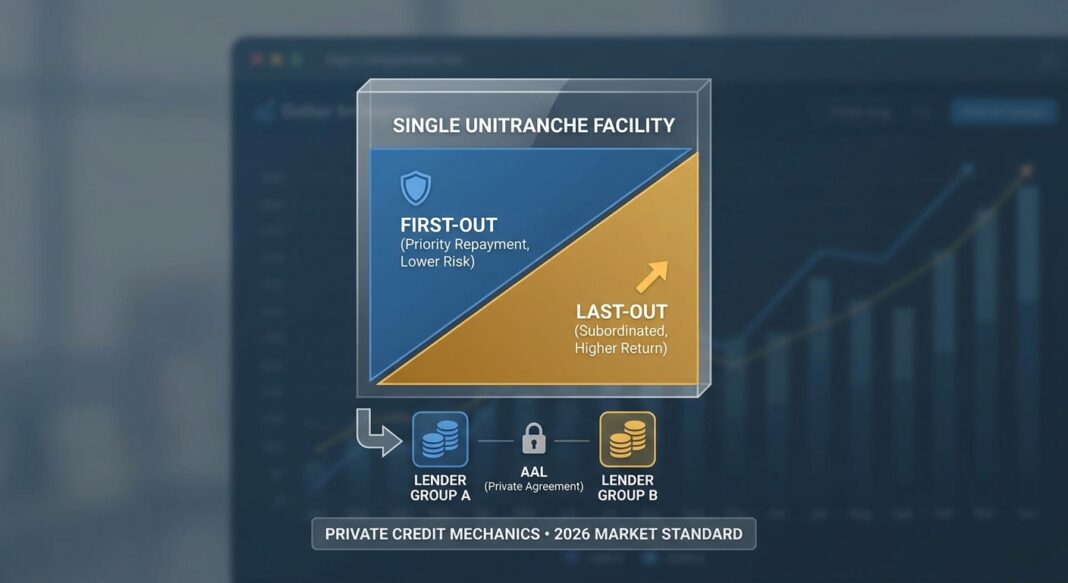
A unitranche is a single secured credit facility in which two or more groups of lenders share the same security interest on the borrower’s collateral but agree among themselves on payment priority through a private side document. As explained by Mayer Brown’s July 2026 analysis of unitranche mechanics, the facility is typically documented in a single credit agreement, with the borrower owing its obligations to a single group of lenders at a blended interest rate. The borrower sees one lender, one set of loan documents, one covenant package, and one blended pricing rate. What the borrower does not see (and is not party to) is the Agreement Among Lenders (AAL), the private contract that divides that single tranche into a “first-out” position (lower risk, lower return) and a “last-out” position (higher risk, higher return).
This is the critical structural distinction: a unitranche is not the same as a first-lien / second-lien arrangement. In a traditional two-lien deal, there are two separate liens on collateral governed by an intercreditor agreement between distinct lender groups. In a unitranche, there is one lien, one credit agreement, and one blended rate, with all risk allocation handled privately among the lenders themselves through the AAL. The borrower benefits from simplified execution; the lenders manage their relative risk positions invisibly.
How the First-Out / Last-Out Split Works: A Concrete Example
Consider a hypothetical mid-market software company being acquired in a $100 million leveraged buyout. The sponsor contributes $40 million in equity and seeks $60 million in debt financing, representing a 6.0x leverage ratio on $10 million of EBITDA. A direct lender structures this as a unitranche with the following architecture:
- Total unitranche facility: $60 million at a blended rate of SOFR + 575 basis points
- First-out tranche: $20 million (a revolving credit facility or senior term loan), priced internally at SOFR + 350 bps, paid first in any cash waterfall or liquidation
- Last-out tranche: $40 million (the bulk term loan), priced internally at SOFR + 700 bps, subordinated to the first-out in all distributions
The borrower writes one check at the blended rate and never negotiates with two separate creditor groups. But inside the AAL, the first-out lender recovers principal and interest ahead of the last-out lender in any default or enforcement scenario. As noted in filings from Crescent Capital BDC’s August 2026 Form 8-K, the last-out portion earns a higher interest rate in exchange for accepting greater risk of loss. With three-month Term SOFR at 3.69% as of June 2026 (per VRC’s Q2 2026 update), the all-in yield on the last-out position in this example would approach 10.69%, meaningfully above the blended rate seen by the borrower.
The speed advantage is real and quantifiable. According to CT Acquisitions’ 2026 Unitranche Financing Guide, a unitranche typically closes in 45 to 90 days versus 90 to 150 days for a traditional senior-plus-mezzanine syndication. For private equity sponsors running acquisition platforms with frequent add-ons, that execution gap is often decisive.
Current Market Conditions: Where Unitranche Stands in Mid-2026
Several converging market forces make understanding unitranche mechanics especially important right now.
Unitranche yields and spreads: According to Valuation Research Corporation (July 2026), unitranche coupon spreads generally range from 4.75% to 5.50%, approximately 25 basis points higher than year-end 2025 levels, with original issue discounts (OIDs) holding steady between 98.75 and 99.25 for standard transactions. On a spot basis, unitranche yields remained broadly stable in Q2 2026, increasing by approximately one basis point quarter-over-quarter.
Total leverage: CT Acquisitions’ 2026 analysis puts total leverage for typical lower-middle-market LBO unitranche transactions at 4.0x to 6.0x EBITDA, rising to as high as 7.0x for high-quality recurring-revenue businesses in sectors such as SaaS and healthcare services.
Covenant evolution: One of the most significant structural shifts in the unitranche market is the creep of covenant-lite documentation from the broadly syndicated loan (BSL) market into direct lending. According to McKinsey’s 2026 Global Private Markets Report, covenant-lite transactions rose to 21% of direct lending deals in 2025, up sharply from just 4% in 2023. The same report notes that loan documentation has become more borrower-friendly, particularly at the upper end of the market where direct lending competes with syndicated financing.
Bank lending standards: The structural backdrop remains supportive for direct lenders. The Federal Reserve’s July 2026 SLOOS reported that C&I lending standards were basically unchanged in Q2 2026, while demand from large and middle-market firms strengthened. Banks are re-entering some corners of the market, but Northleaf Capital’s Q1 2026 Private Credit Market Update notes that periods of market volatility continue to see banks and liquid credit markets retrench, with private equity sponsors turning to private credit for greater execution certainty.
Market scale: The scale of the platforms originating these transactions is now enormous. CT Acquisitions’ 2026 ranking places Apollo Global Management at roughly $600 billion in credit AUM, Ares Management at $464 billion, and Blackstone Credit and Insurance at $354 billion. When platforms of this size set pricing conventions, those conventions define market terms.
| Metric | Value | Source |
|---|---|---|
| Unitranche coupon spread range | SOFR + 4.75% – 5.50% | VRC, Q2 2026 |
| 3-Month Term SOFR (June 2026) | 3.69% | VRC, Q2 2026 |
| Typical total leverage (LMM LBO) | 4.0x – 6.0x EBITDA | CT Acquisitions, 2026 |
| Cov-lite share of direct lending deals (2025) | 21% (up from 4% in 2023) | McKinsey, June 2026 |
| CDLI 2025 annual return | 9.3% | Alternative Fortune / Cliffwater, 2026 |
Decision Framework: Investors and Operators
For investors evaluating private credit funds: The first question to ask a fund manager is not the headline yield; it is the composition of the portfolio’s unitranche exposure. A fund heavily weighted toward last-out positions earns wider spreads but absorbs subordinated risk in any default or restructuring. As the Alternative Fortune / Cliffwater 2026 analysis notes, last-out lenders can price at SOFR + 850 bps or more but can recover far less than first-out lenders in a default scenario. Investors should also scrutinise covenant quality. The rapid rise in covenant-lite documentation identified by McKinsey means that maintenance covenants, historically the early-warning system for deteriorating credits, are present in a shrinking share of new deals. Ask specifically: does this portfolio hold maintenance covenants, and how many of those are tested quarterly? Finally, consider platform scale and deal flow. Morgan Lewis’s July 2026 analysis notes that larger asset managers are increasingly advantaged in winning the best credits, as their speed, certainty of execution, and balance sheet capacity are difficult for smaller managers to replicate.
For business operators considering unitranche financing: The unitranche is typically the right tool when speed and simplicity outweigh cost. The 2026 unitranche market data suggests it is the dominant solution for enterprise values between $25 million and $200 million: below that range, bank or SBA financing wins on cost; above $300 million, the broadly syndicated loan market becomes more competitive. Operators should weigh the blended pricing premium (typically 50–100 basis points above a traditional senior loan) against the value of execution certainty, single-lender relationships, and confidentiality. OID matters: on a $50 million unitranche with a 2% OID, the borrower receives $49 million but owes $50 million in principal, adding roughly 33 basis points of annualised cost on a six-year loan. Prepayment schedules, typically 102/101/par in the current market, should be scrutinised carefully if a refinancing or sale is contemplated within the first three years.
Key Takeaways
- One tranche, two risk profiles: A unitranche presents a single face to the borrower but internally divides lenders into first-out (lower risk/return) and last-out (higher risk/return) positions via a private Agreement Among Lenders that the borrower never sees.
- Dominating new issuance: Unitranche structures currently dominate middle-market new issuance, with coupon spreads of SOFR + 4.75% to 5.50% and all-in yields broadly ranging between 9% and 10%+ as of mid-2026.
- Covenant quality is eroding: Covenant-lite terms have risen to 21% of direct lending deals, five times the 2023 share. Investors should scrutinise whether their fund’s portfolios retain maintenance covenants that provide early intervention rights.
- Speed is the primary operator benefit: A unitranche can close in 45–90 days versus 90–150 days for syndicated structures, making it the preferred tool for acquisitive platforms where execution certainty is valued over pricing optimisation.
- Scale is concentrating: Apollo ($600B), Ares ($464B), and Blackstone ($354B) together represent the largest pools of unitranche capital. When the three largest platforms align on terms, those terms become market standard, understanding their current preferences is essential for both borrowers and competing lenders.


