
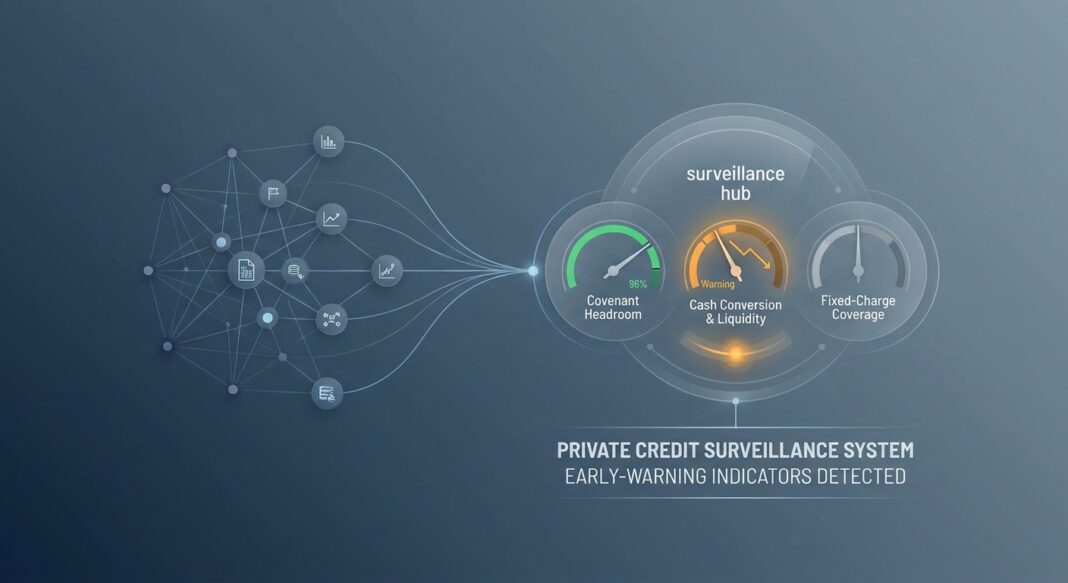
When does a borrower that still reports covenant compliance become a credit problem? The answer often appears first in cash conversion, liquidity use, or repeated requests for payment relief, before a formal default or a missed covenant test. Monitoring that relies on quarterly leverage certificates alone can therefore report a clean portfolio while individual credits lose debt-service capacity.
A disciplined surveillance system tests whether reported earnings are turning into cash, whether liquidity covers near-term obligations, and whether a borrower can refinance or repay at maturity without new capital. It also records amendments, waivers, PIK interest, and delayed payments as credit events for internal risk purposes, even when documents do not classify them as defaults. This article sets out a borrower-level monitoring method and a portfolio-level escalation process. The calculations below use a clearly illustrative manufacturing borrower; the assumptions are examples, not market benchmarks.
The framework: monitor capacity, liquidity, and change
Start with a verified closing baseline: lender-approved EBITDA, total and net debt, cash interest, scheduled principal, minimum cash, revolver availability, covenant definitions, and maturity dates. Keep the executed credit agreement and approved EBITDA bridge beside each reporting period’s calculations. Reconcile borrower reporting to financial statements, bank statements, borrowing-base certificates, and the lender’s own debt ledger.
At each reporting date, calculate gross leverage as total funded debt divided by lender EBITDA, and net leverage as funded debt less unrestricted cash divided by lender EBITDA. Calculate cash interest coverage as EBITDA divided by cash interest, but do not treat it as a substitute for cash-flow coverage. A more useful payment test is fixed-charge coverage: cash available for debt service divided by cash interest plus scheduled principal and other defined fixed charges. State the numerator precisely. A practical version starts with EBITDA and deducts cash taxes, maintenance capital expenditure, and working-capital investment.
Track covenant headroom against the actual agreement, using its debt and EBITDA definitions. For a maximum leverage covenant, show both the absolute cushion in turns and percentage cushion: (maximum permitted leverage ÷ actual leverage) − 1. Track liquidity as unrestricted cash plus genuinely available revolver capacity, less near-term mandatory uses and any minimum-cash requirement. Add qualitative indicators: customer concentration changes, management departures, order cancellations, insurance claims, supplier tightening, delayed audits, and sponsor support conditions.
Set reporting frequency by risk, not by habit. Monthly flash information can be appropriate when liquidity is tightening; quarterly financial statements and compliance certificates remain the minimum for many term loans. Define alerts in the credit file, assign an owner, require documentary support, and record the response. One threshold should not be treated as universal across industries or loan structures.
The analysis: an illustrative $10 million EBITDA borrower
Assume a manufacturer closes with $45 million of funded debt, $2 million of unrestricted cash, $10 million of lender EBITDA, $4.95 million of annual cash interest, $0.9 million of annual principal amortization, and a maximum net leverage covenant of 5.0x. Net leverage is ($45 million − $2 million) ÷ $10 million, or 4.3x. The absolute covenant cushion is 0.7x; percentage headroom is (5.0 ÷ 4.3) − 1, or about 16.3%.
Now assume quarterly tracking indicates EBITDA has fallen 15% to $8.5 million while debt and cash interest are unchanged. Net leverage rises to $43 million ÷ $8.5 million, or 5.06x, above the assumed covenant ceiling. Cash interest coverage falls from 2.02x to 1.72x. The change is not just a ratio breach: it is a prompt to reconcile volume, price, gross margin, staffing, and adjustments against source records.
For a simple cash-flow stress, assume the lower EBITDA period requires $1.0 million of maintenance capex, $0.4 million of cash taxes, and $0.6 million of working-capital investment. Cash available for debt service is $6.5 million. Against $4.95 million interest plus $0.9 million amortization, fixed-charge coverage is $6.5 million ÷ $5.85 million, or 1.11x. The lender should then test a further sales or margin decline, a slower collection cycle, and reduced revolver availability. Recalculate liquidity by month through the next maturity, not only at quarter-end. If a proposed cure depends on an uncommitted sponsor contribution or an asset sale without a signed agreement, show that as a separate upside case, not base liquidity.
Industry standards and credit-performance context
Institutional surveillance should distinguish contractual default from economic deterioration. Review compliance certificates, cash receipts, borrowing-base reports, appraisal changes, amendments, payment-in-kind elections, and maturity plans. The October 2026 IMF Global Financial Stability Report reported median debt-to-EBITDA leverage of 7.05x for its reviewed U.S. direct-lending borrower sample in 2026 Q2, including 8.1x for software borrowers (observations as of Q2 2026). These sample statistics are not leverage targets or direct comparables for a specific loan.
In the same October 2026 report, the IMF found that borrower commitments exceeded available liquidity buffers at four of ten reviewed BDCs, representing about $90 billion in assets (sample and calculations as presented in the October 2026 report). Its analysis cautions that amendments and extensions can coexist with falling reported default rates while leverage and reliance on outside financing increase. This is why a portfolio dashboard should track liquidity provided to borrowers as well as liquidity available to the lender.
Proskauer’s Private Credit Default Index, released October 27, 2026, reported a 2.41% default rate for U.S. senior-secured and unitranche loans during July 1 to September 30, 2026, down from 2.51% in Q2; it covered 746 loans and $205.7 billion in original principal. Proskauer also reported increased trailing-12-month defaults and rising software and technology defaults. The index’s defined loan universe and default methodology differ from other rating-agency series, so do not combine rates as if they were one dataset.
A recent public filing illustrates why event logs matter: Bright Mountain Media’s September 30, 2026 quarterly filing described cash interest converted to PIK and scheduled amortization deferred to maturity, following prior amendments. Such concessions may provide time, but they do not create operating cash flow. Record the original due date, revised terms, fees, new money, and the borrower’s performance against each amendment milestone. Repeated extensions, PIK, or asset-sale proceeds used for debt service warrant a refreshed downside and recovery review.
Underwriting checklist: build the surveillance file
- Obtain monthly management accounts, quarterly financial statements, annual audited statements, compliance certificates, cash-flow statements, bank statements, and current debt schedules.
- Reconcile reported EBITDA to the approved lender definition. Identify new add-backs, acquisition contributions, unusual working-capital movements, and changes in accounting policy.
- Recalculate gross and net leverage, cash interest coverage, fixed-charge coverage, covenant cushion, unrestricted liquidity, and a monthly liquidity forecast through the next maturity.
- Ask what caused any variance: lost customers, lower pricing, production downtime, slower collections, inventory build, supplier changes, or unplanned capex. Request source documents and compare management explanations with actual cash receipts.
- Review revolver availability, borrowing-base eligibility, lien priority, collateral reporting, insurance, legal notices, and near-term maturities. Confirm whether contingent commitments can be drawn and whether lender-side liquidity can meet them.
- Log covenant amendments, waivers, PIK, missed or delayed payments, asset sales, sponsor contributions, and management changes. Assign each exception an owner, a deadline, a trigger for escalation, and a documented resolution.
Escalate when the facts deteriorate, not only when a covenant is breached. Preserve dated calculations and the source files behind them so a new analyst, portfolio committee, or workout team can reconstruct the decision trail.
Key takeaways
- Track cash conversion and scheduled debt service alongside EBITDA leverage.
- Measure covenant cushion using the executed agreement’s definitions.
- Treat PIK, repeated extensions, and delayed payments as surveillance signals.
- Stress liquidity monthly through maturity, including contingent draws.
- Separate reported portfolio default rates from borrower-specific risk evidence.


