
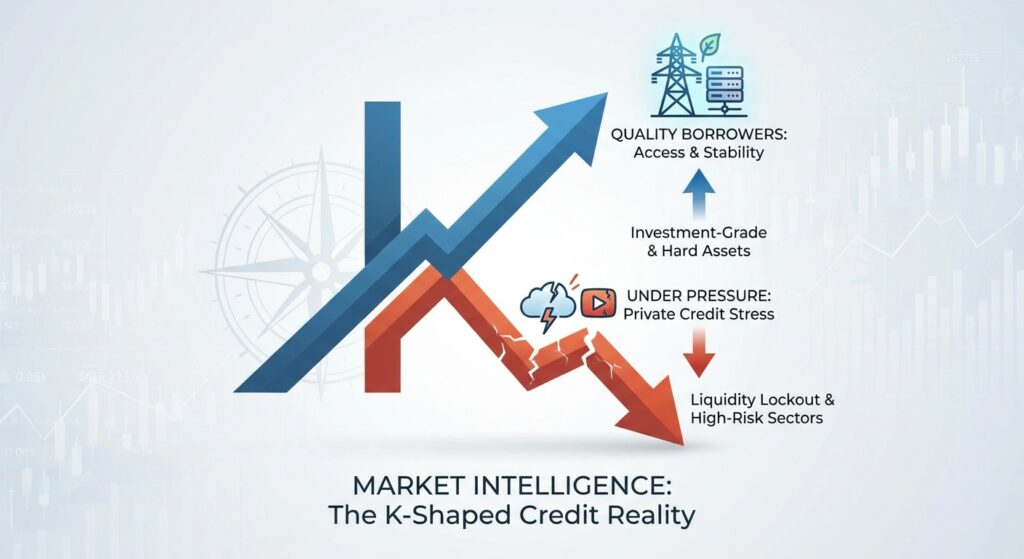
Market Headline: A Market Fracturing Along Quality Lines
The credit landscape entering Q2 2026 is no longer a single market; it is two markets operating under the same roof. A confluence of macro shocks, including the oil-driven inflation resurgence, a Federal Reserve rate-cutting pause, aggressive trade tariffs, and the structural disruption of AI on software valuations, has produced the most pronounced quality-based credit bifurcation since the 2020 pandemic shock.
Total U.S. leveraged loan primary activity collapsed to approximately $235–$241 billion in Q1 2026, representing a 32–34% decline versus Q1 2025’s $355 billion, according to data reported by investor.wedbush.com and confirmed by sikich.com. This marks the slowest start to a year for credit markets since 2020. Refinancing and repricing activity, the engine of 2025 volume, fell 42% and 39%, respectively, as borrower opportunism dried up in the face of spread widening and deteriorating investor sentiment.
Yet beneath those headline figures, the top tier of the borrower universe (investment-grade and upper-BB corporates with hard assets and predictable cash flows) continues to access capital on favorable terms. The bottom 10% of issuers, particularly those concentrated in software, media, and leveraged-buyout-heavy sectors, face a de facto liquidity lockout. The “90/10 rule” is now the operative framework for credit market participation in 2026.
Quantitative Market Snapshot
The data box below captures the key metrics defining current market conditions across public and private credit. All figures are sourced from institutional research published between January and April 2026.
| Metric | Current Value (Q1 2026) | Prior Period | Direction | Source |
|---|---|---|---|---|
| Total U.S. Leveraged Loan Issuance (Q1) | ~$241B | ~$355B (Q1 2025) | ▼ 32–34% | sikich.com |
| Single-B BSL Loan Spreads (late 2025 baseline) | SOFR + ~420 bps (widened ~100 bps in Feb–Mar) | SOFR + 319 bps (late Nov 2025) | ▼ Widening | sikich.com / mondaq.com |
| Middle Market Unitranche Spreads | SOFR + ~450–500 bps (estimated, widened from tights) | SOFR + ~450 bps (Q4 2025) | ▶ Stable to slightly wider | mondaq.com |
| High-Yield Bond Spread (B-rated) | 3.17% (Mar 2026) | 2.65% (Jan 2026) | ▼ Widening +52 bps | investor.wedbush.com |
| U.S. Private Credit Default Rate | 9.2% (2025, Fitch) | 8.1% (2024) | ▼ Record High | atlaspeakresearch.com |
| Distress Ratio (loans trading below 80¢) | 7.23% (Mar 2026) | ~4–5% (mid-2025 est.) | ▼ 3-Year High | investor.wedbush.com |
| Listed BDC Price-to-Reported NAV | ~78 cents on the dollar (Mar 12, 2026) | ~85 cents (Jan 2026) / ~par (early 2025) | ▼ Deteriorating | atlaspeakresearch.com |
| Software Sector Avg. Loan Leverage | 7.4x EBITDA | 5.9x (broader loan pool) | ▼ Elevated Risk | atlaspeakresearch.com |
On KPI expectations, the underwriting environment has tightened sharply for lower-rated borrowers. Lenders are demanding stronger fixed charge coverage ratios (with a reported preference for FCCR of 1.5x or above for new middle-market originations in stressed sectors) and are scrutinizing debt-to-EBITDA multiples far more aggressively. The era of 7x–8x leverage on software and media deals is effectively closed for any borrower outside the upper credit tier. Borrowers below $30 million in EBITDA face double-digit default rates, per FSOC data cited by atlaspeakresearch.com, underscoring the size-based dimension of this bifurcation.
Sector Analysis: Where Lenders Are Moving, and Retreating
🔴 Software & SaaS: The Epicenter of Pressure
Software has become the most structurally challenged sector in the private credit market. According to data cited by atlaspeakresearch.com, software accounts for approximately 16% (~$235B) of the $1.5 trillion U.S. loan market, with 50% of software loans rated B- or lower, and ~46% of software maturities falling within four years. The compounding problem: software equities are down approximately 22% since January 2026, directly inflating loan-to-enterprise-value ratios and making refinancing math increasingly difficult. Private credit software and services exposure is estimated at ~20% of portfolio assets (BNP estimates, per Atlas Peak). The “SaaSPocalypse” narrative (driven by fears that agentic AI tools from Anthropic and OpenAI will disrupt traditional SaaS seat-based revenue) has triggered a measurable sector rotation out of software-heavy loan portfolios.
🟢 Energy, Infrastructure & AI Data Centers: Capital Flows In
Hard-asset sectors are absorbing the capital displaced from software. AI-integrated data center infrastructure and energy remain the clearest beneficiaries. Oracle’s $38 billion debt package for AI data center expansion was cited as a marquee example of continued elite-tier access by investor.wedbush.com. Power and infrastructure deals are increasingly viewed as defensive credits with predictable cash flows and hard collateral, exactly the profile lenders are prioritizing in 2026’s risk-off environment.
🟡 Healthcare: Selective, Tariff-Sensitive
Healthcare remains a sought-after sector but is not immune from stress. The April 2026 anniversary of pharmaceutical tariffs, including a 100% tariff on select branded drugs, has introduced fresh uncertainty into supply chains, per investor.wedbush.com. Lenders are conducting deeper diligence on international revenue and supply chain exposure. Hologic’s successful $7.25 billion loan pricing demonstrates that differentiated, cash-flow-positive healthcare companies can still clear the market, but only at the upper end of the quality spectrum.
🔴 Media & Traditional Consumer: Structural Distress
Media credits are deteriorating rapidly. Cumulus Media’s second Chapter 11 filing in March 2026 to restructure $592 million in debt, cited by investor.wedbush.com, is emblematic of a sector facing secular structural decline compounded by cyclical credit tightening. Private lenders are broadly avoiding new originations in legacy media.
Structural Shift: Retailization Stress in Private Credit Vehicles
A critical structural dynamic is the stress now evident in semi-liquid, wealth-channel private credit vehicles. As documented by atlaspeakresearch.com, multiple major vehicles (including Blackstone BCRED ($3.7B in Q1 redemption requests, representing 7.9% of NAV), BlackRock HLEND ($1.2B / 9.3% of NAV), and Cliffwater Corporate Lending Fund (~14% requests, capped at 7%)) have hit or approached their contractual redemption gates. The structural mismatch between periodic liquidity promises and illiquid underlying assets is now an active systemic concern, not a theoretical one. Payment-in-kind (PIK) income as a share of BDC earnings has also risen significantly since 2019, per FSOC data, masking the true pace of credit quality deterioration in reported financials.
Implications for Institutional Investors & Operators
For Institutional Investors
The divergence between reported NAV and public market pricing for listed BDCs, now at approximately 78 cents on the dollar versus par just 12 months ago, signals that the private credit market is undergoing a credibility repricing, not merely a spread adjustment. Investors allocated to semi-liquid structures must pressure-test their underlying liquidity assumptions. The key question is not whether the portfolio is insolvent, but whether the liquidity sleeve, typically 10–40% in perpetual BDCs per atlaspeakresearch.com, can sustain synchronized redemption demand before asset quality in the residual pool degrades further.
Valuation opacity remains the core analytical risk. FSOC has explicitly flagged that the same or similar loans can be carried at materially different valuations across BDCs and private funds, using unobservable inputs. Institutional allocators should demand granular, loan-level transparency and treat elevated PIK income ratios as a yellow flag on true credit quality.
Opportunity, however, is emerging. Distressed debt and special situations specialists (operating with patient, long-duration capital) are positioned to provide rescue financing to the “lower arm” of the K-shape at double-digit all-in yields. That spread premium compensates for elevated default risk only if underwriting is disciplined and collateral recovery assumptions are stress-tested against realistic enterprise value impairment scenarios in software and media.
For Operators & Borrowers
Companies approaching debt walls in late 2026 and 2027 face a materially different refinancing market than the one in which their existing facilities were originated. The critical KPI thresholds are hardening: lenders in the current environment are prioritizing FCCR above 1.5x, debt-to-EBITDA below 5.5x for most non-software sectors, and meaningful hard-asset collateral or contracted revenue visibility. Borrowers below $30 million in EBITDA should anticipate constrained access, higher pricing, and tighter covenant packages. Asset monetization, non-core divestitures, and early engagement with existing lenders on amend-and-extend structures are the most prudent near-term capital management actions, per the outlook framed by investor.wedbush.com.
Forward-Looking View: The Next 3–6 Months
The credit market’s trajectory through H2 2026 hinges on three variables: the Federal Reserve’s ability to resume its rate-cutting cycle (currently on pause due to oil-driven inflation), whether the software sector’s equity impairment translates into a broad wave of payment defaults (Morgan Stanley’s base case remains a slow-burn, not an acute spike, per atlaspeakresearch.com), and the pace of redemption pressure on semi-liquid private credit vehicles.
If rates remain elevated through year-end, the distress ratio, currently at a three-year high of 7.23%, will likely climb further, and the 30–46% of software loans maturing by 2028 will represent an accelerating refinancing cliff. Restructuring advisory activity is expected to increase materially, benefiting institutions with dedicated credit restructuring capabilities.
Public bond market liquidity, by contrast, is holding up better than headlines suggest. Data from pimco.com shows that corporate bond market depth, breadth, and transaction costs are near their healthiest levels since the global financial crisis, with bid-ask spreads close to all-time lows and turnover rising across both investment-grade and high-yield segments. This liquidity divergence (robust in public bonds, stressed in private credit) may drive incremental capital reallocation toward liquid public credit structures over the next two quarters, particularly among institutional allocators with liability-matching constraints.
Key Market Insights
- The 90/10 Market is Real: U.S. leveraged loan primary volume fell 32–34% in Q1 2026, but the top tier of borrowers (investment-grade and upper-BB with hard assets) continues to clear the market. The bottom decile faces de facto liquidity exclusion. (sikich.com)
- Private Credit Default Risk is Not Theoretical: The U.S. private credit default rate reached a Fitch-reported record of 9.2% in 2025, up from 8.1% in 2024, with double-digit defaults among borrowers below $30M in EBITDA. PIK income masking is a live analytical risk. (atlaspeakresearch.com)
- Software Is the Fault Line: At 7.4x average EBITDA leverage, a 22% equity selloff, and ~46% of maturities within four years, the software sector is the highest-conviction source of private credit stress in 2026. Lenders are repricing or exiting new software originations. (atlaspeakresearch.com)
- Semi-Liquid Vehicle Gates Are an Active Risk: Redemption requests at BCRED, HLEND, Cliffwater, and North Haven have stress-tested wealth-channel private credit liquidity promises in real time. Liquidity sleeve exhaustion is a structural, not idiosyncratic, vulnerability in perpetual BDC vehicles. (atlaspeakresearch.com)
- Public Bond Liquidity Is a Relative Safe Harbor: Contrary to private credit manager narratives, PIMCO’s TRACE analysis shows public corporate bond depth, breadth, and transaction costs are near post-GFC bests. Institutional allocators may find better risk-adjusted liquidity in public credit while private market price discovery remains opaque. (pimco.com)


