
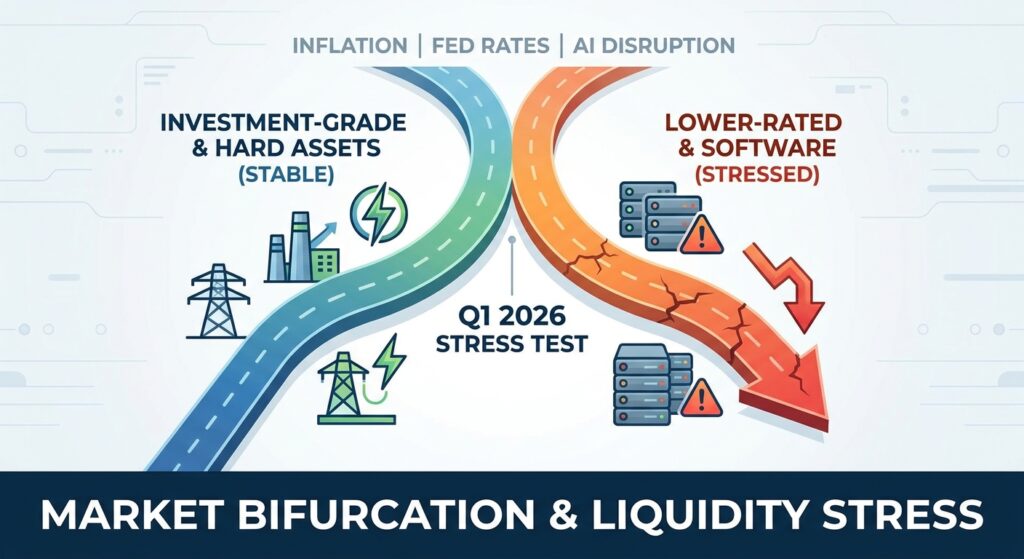
Market Headline: Credit’s K-Shaped Reckoning
The U.S. credit markets entered 2026 on uneven footing, and Q1 made the fault lines impossible to ignore. Total leveraged loan primary activity collapsed to approximately $235–$241 billion, representing a 32–34% decline versus Q1 2025, marking the weakest opening quarter since the pandemic-era freeze of 2020. The culprit was not a single shock but a convergence: persistent inflation reignited by an oil price surge above $120/barrel, a Federal Reserve unwilling to resume rate cuts, aggressive trade policy uncertainty, and a sector-specific technology valuation implosion accelerated by agentic AI disruption narratives. The result is a classic K-shaped credit market: the top tier of investment-grade and BB-rated borrowers continues to access capital efficiently, while the lower-rated, software-heavy, and leveraged cohort faces a genuine liquidity reckoning. As sikich.com noted, BB-or-higher credits represented a growing share of Q1 issuance, while the lowest-rated segment accounted for a historically small portion of M&A volume. This is no longer a cyclical dip; it is a structural repricing of credit risk across both public and private markets.
Quantitative Market Snapshot
The data below captures the current state of credit pricing, volume, and structural stress across public and private markets as of April 2026.
| Metric | Current Reading (Q1 2026) | Prior Period | Direction | Source |
|---|---|---|---|---|
| Total Leveraged Loan Primary Volume | ~$241B | ~$355B (Q1 2025) | ↓ 32–34% | sikich.com |
| Net New-Money Issuance | ~$70B | Modest decline vs. prior year | ↓ Modest | sikich.com |
| Leveraged Loan Spreads (Active Segment) | Widened ~100 bps (Feb–Mar) | January 2026 favorable pricing | ↓ Wider | sikich.com |
| High-Yield Bond Spreads (B-rated) | 3.17% (up from 2.65%) | 2.65% at start of Q1 2026 | ↓ Wider ~52 bps | investor.wedbush.com |
| Private Credit Default Rate (U.S.) | 9.2% (Fitch, full-year 2025) | 8.1% (2024) | ↓ Deteriorating | atlaspeakresearch.com |
| Distress Ratio (Loans <80 cents) | 7.23% (March 2026) | Below 5% (3 years prior) | ↓ 3-Year High | investor.wedbush.com |
| Public BDC Discount to Reported NAV | ~78 cents on the dollar (Mar 12) | ~85 cents (Jan 2026); ~par (early 2025) | ↓ Widening Discount | atlaspeakresearch.com |
| Private Credit Market Size (Global AUM) | ~$1.8T (U.S. ~6% of GDP) | ~1% of GDP in 2008 | ↑ Structural Growth | cressetcapital.com |
From a KPI underwriting perspective, lender discipline is visibly tightening. Software borrowers entering the market now face average leverage of 7.4x EBITDA: a figure lenders are increasingly unwilling to underwrite, compared to 5.9x across the broader loan pool, per atlaspeakresearch.com citing KBRA data. Fixed charge coverage ratios (FCCR) are under material pressure across floating-rate borrowers, as base rates remain elevated with no Fed pivot in sight. For middle-market operators, the practical floor for lender appetite now sits at FCCR of 1.20x or above, with lower-quartile credits below that threshold effectively locked out of syndicated refinancing.
Sector Analysis: Where Capital Is Flowing, and Where It Has Stopped
🔴 Software & SaaS: The Epicenter of Stress
Software has become the defining pressure point of the 2026 credit cycle. Per atlaspeakresearch.com, software accounts for approximately 16% (~$235B) of the $1.5 trillion U.S. loan market, with private credit software exposure estimated at ~20% by BNP Paribas. Critically, 50% of software loans are rated B- or lower, over 80% are issued by private companies, and 46% of the cohort matures within four years, creating a crowded and structurally fragile refinancing wall. The emergence of agentic AI tools threatening traditional SaaS seat models has triggered equity market selloffs of approximately 22% in software stocks since January 2026, directly elevating loan-to-enterprise-value (LTV) ratios and triggering mark-to-model credibility concerns. Lender appetite for new software origination has materially contracted, with several managers explicitly tightening underwriting standards around ARR-to-debt multiples and requiring stronger covenant packages.
🟡 Infrastructure, Energy & Hard Assets: The Beneficiaries
Capital rotation out of software-heavy loan portfolios and into hard-asset sectors is a defining structural shift of Q1 2026. Infrastructure, energy, and equipment-backed credits are attracting disproportionate lender attention as investors seek collateral clarity and contracted cash flows. Per cressetcapital.com, asset-backed private credit strategies (including equipment leasing, infrastructure cash flows, and royalty streams) are attracting renewed institutional allocation due to their superior collateral position and tax advantages from restored bonus depreciation. Oracle’s successful pricing of a $38 billion AI data center debt package and Hologic’s $7.25 billion loan pricing confirm that capital-intensive, cash-flow-positive hard-asset businesses retain full market access even in this environment.
🟠 Healthcare & Consumer: Selective but Open
Healthcare supply chains carry elevated uncertainty following tariff implementations on branded pharmaceuticals, as flagged by investor.wedbush.com. Lenders are scrutinizing international exposure more aggressively, demanding stronger covenant packages and tighter leverage thresholds. Consumer-facing credits with domestic revenue concentration and visible FCCR headroom above 1.25x continue to access capital, while those with cross-border complexity face spread premiums and deal-level pushback on structure.
Implications: What This Means for Institutional Investors and Operators
For Institutional Investors
The most consequential development for institutional allocators is the structural liquidity mismatch now being exposed in wealth-channel private credit vehicles. As documented by atlaspeakresearch.com, Blackstone’s BCRED faced $3.7 billion in redemption requests (7.9% of NAV) in Q1, requiring sponsor capital injection of $400 million. BlackRock’s HLEND saw $1.2 billion in withdrawal requests (9.3% of NAV), while Cliffwater’s Corporate Lending Fund faced ~14% redemption requests capped at 7%. These are not isolated events; they represent the first systemic stress test of the retailization model for private credit. Allocators must critically distinguish between closed-end, drawdown-structure vehicles (where capital lockups match loan maturities and run risk is low) and semi-liquid interval or perpetual BDC structures where liquidity mismatch risk is materially elevated. Public BDC discounts to reported NAV widening to ~78 cents on the dollar from near par in early 2025 signals that public markets are applying a meaningful valuation haircut to private marks, warranting a fresh review of portfolio-level mark-to-model assumptions and NAV credibility across existing allocations.
For Business Operators and Borrowers
The practical implications for middle-market operators are direct: the bar for credit access has materially risen. Lenders are demanding stronger FCCR floors (1.20x–1.25x minimum), tighter leverage multiples, and more protective covenant packages, particularly in software-adjacent and consumer discretionary verticals. Refinancing windows for lower-rated borrowers are narrowing rapidly, and sikich.com explicitly flagged that maturity pressure is becoming concentrated among weaker borrowers with limited near-term relief options. Operators facing debt maturities in 2026–2027 should engage lenders proactively, stress-test FCCR under base-rate scenarios, and explore asset-backed financing structures where collateral can anchor improved pricing. Rescue financing from private credit providers remains available but is pricing at double-digit all-in yields, as noted by investor.wedbush.com.
Forward View: The Next 3–6 Months
The credit market’s trajectory through mid-2026 will be determined by three variables: the Federal Reserve’s rate path, the pace of software sector credit deterioration, and whether BDC redemption pressure stabilizes or intensifies. cressetcapital.com frames the current dislocation accurately; this is a liquidity mismatch and underwriting discipline repricing, not a generalized solvency event. Private credit spreads in the 5% range continue to offer meaningful compensation over public alternatives, and middle-market borrowers still require flexible capital that banks remain structurally constrained from providing at scale.
However, with Fitch’s private credit default rate already at a record 9.2% and the distress ratio at a three-year high of 7.23%, the risk of a more disorderly repricing cycle is real if oil prices sustain above $120, the Fed remains on hold, or software sector defaults accelerate beyond current consensus. Distressed debt specialists and direct lenders with the balance sheet to originate selectively (particularly in asset-backed, infrastructure, and cash-flow-stable credits) are positioned to benefit from the dislocation. The watchword for H1 2026 is structural rigor: for every deal, lenders will require clear collateral visibility, demonstrable FCCR headroom, and covenant packages that reflect current cycle realities rather than the peak-liquidity assumptions of 2021–2023.
📌 Key Market Insights
- The 90/10 Rule Is Now the Market Reality: 90% of the leveraged credit market remains stable and accessible for BB-or-higher credits; the bottom 10% (concentrated in software, media, and highly leveraged lower-middle-market borrowers) is facing an existential liquidity crunch with limited refinancing options through at least H1 2026.
- Private Credit Defaults Have Hit a Record: Fitch’s U.S. private credit default rate reached 9.2% in 2025, up from 8.1% in 2024, with small-borrower cohorts (sub-$30M EBITDA) already experiencing double-digit default rates, a direct warning signal for lenders underwriting at aggressive leverage multiples without strong covenant protection.
- Retailization Risk Is Being Repriced in Real Time: Redemption gates at BCRED, HLEND, North Haven, and Cliffwater’s Corporate Lending Fund are not isolated events; they are the first real-world stress test of the semi-liquid private credit model, and institutional allocators must urgently audit vehicle structure and liquidity terms across their private credit portfolio.
- Sector Rotation Is Structural, Not Cyclical: Capital is actively rotating away from software-heavy loan portfolios and toward hard-asset, infrastructure, and asset-backed credits. This shift reflects both AI-driven disruption of SaaS business model valuations and lender demand for collateral-anchored underwriting, a rotation likely to persist through 2026 regardless of macro resolution.
- FCCR and Covenant Discipline Are the New Gatekeepers: Lenders are re-establishing KPI floors that were loosened during the 2021–2023 liquidity surge. Operators who can demonstrate FCCR above 1.20x–1.25x, realistic deleveraging paths within 3–4 years, and covenant compliance under stress scenarios will access capital; those who cannot will face double-digit rescue financing costs or restructuring conversations.


