
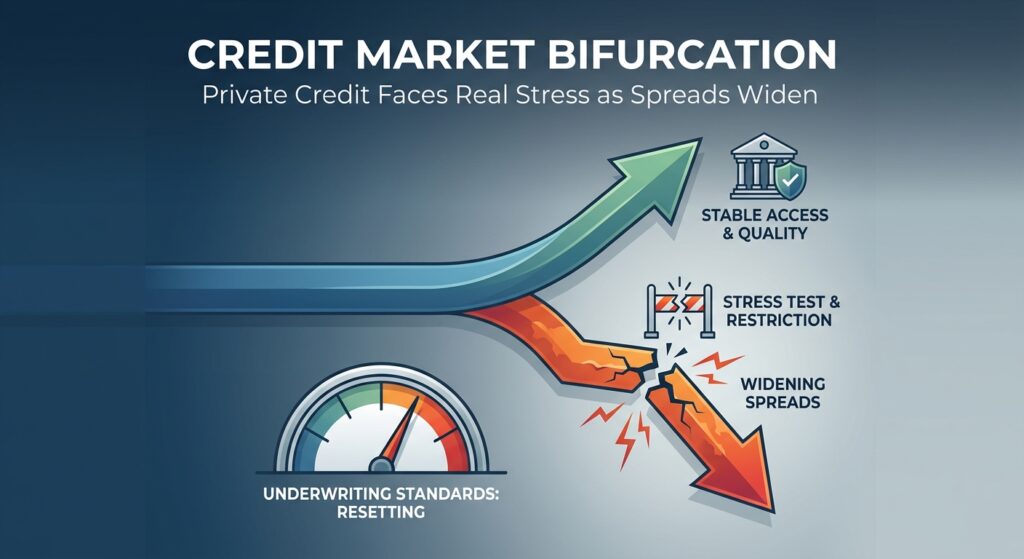
The K-Shape Hardens: Credit Markets Enter a Selective, Higher-Cost Regime
The opening quarter of 2026 has delivered an unambiguous verdict: the era of indiscriminate credit availability is over. What has replaced it is a structurally bifurcated market: one in which investment-grade and upper-middle-market borrowers retain workable access to capital, while lower-rated, covenant-light, and software-heavy credits face a wall of widening spreads, tightening underwriting standards, and in some cases outright market exclusion.
The headline data is stark. Total leveraged loan primary activity, including repricings, reached approximately $241 billion in Q1 2026: running 32–34% below the same period in 2025, making it the slowest start to a year since the 2020 pandemic shock. Refinancings and repricings, which typically drive headline volume, collapsed by 42% and 39% respectively, as the repricing cycle exhausted itself and macro volatility choked off opportunistic borrower activity. Meanwhile, the U.S. private credit default rate climbed to a record 9.2% in 2025 (up from 8.1% in 2024), with stress concentrated in borrowers carrying less than $30 million in EBITDA, precisely the cohort that private lenders aggressively courted during the 2021–2022 vintage boom. Sources: sikich.com, marketminute.com.
The macroeconomic trigger was a compounding of forces: geopolitical instability, an oil price surge above $120/barrel reigniting inflation fears, and the Federal Reserve pausing its rate-cutting cycle. The result is a credit market operating under a “90/10 rule”: where the top 90% of borrowers by quality retain market access, but the bottom 10% faces an existential liquidity crunch that threatens a wave of defaults and restructurings through the remainder of 2026. Source: investor.wedbush.com.
Quantitative Market Snapshot: Spreads, Yields, Leverage & Default Metrics
| Metric | Current Reading (Q1 2026) | Prior Period | Direction | Source |
|---|---|---|---|---|
| Leveraged Loan Primary Volume (Q1) | ~$241B | ~$355B (Q1 2025) | ▼ 32–34% | sikich.com |
| High-Yield Bond Spreads (B-rated credits) | Widened ~100 bps vs. Jan 2026; OAS moved from ~2.65% to ~3.17% | Q4 2025 tights | ▼ Risk-Off | investor.wedbush.com |
| Distress Ratio (Loans < 80 cents) | 7.23% (March 2026) | Below 5% (mid-2025) | ▼ 3-Year High | investor.wedbush.com |
| U.S. Private Credit Default Rate | 9.2% (2025, record high per Fitch) | 8.1% (2024) | ▼ Worsening | marketminute.com |
| Software Sector Avg. Leverage (Private Credit) | 7.4x EBITDA | 5.9x (broader loan pool) | ▼ Elevated Risk | atlaspeakresearch.com |
| Listed BDC Price-to-NAV | ~78 cents on the dollar (Mar 12, 2026) | ~85 cents (Jan 2026); ~par (early 2025) | ▼ Significant Discount | atlaspeakresearch.com |
| “Bad PIK” (Distressed Deferral) Share of Private Debt Volume | 6.4% (Q1 2026) | Elevated vs. 2023 baseline | ▼ Loss-Recognition Risk | marketminute.com |
On KPI expectations, lenders are re-anchoring underwriting to concrete coverage and leverage thresholds. Borrowers with interest coverage ratios below 1.0x, a condition now affecting a meaningful share of floating-rate middle-market names according to IMF 2024 analysis cited by atlaspeakresearch.com, are finding refinancing windows effectively closed. Fixed Charge Coverage Ratio (FCCR) hurdles of 1.10x–1.20x, once accepted on a best-efforts basis, are now being enforced with covenant teeth. Debt-to-EBITDA limits for new originations are compressing from a permissive 6.0–7.0x range back toward a more disciplined 4.5–5.5x ceiling for non-investment-grade borrowers.
Sector Analysis: Where Lenders Are Opening and Closing the Spigot
Under Pressure: Software & Technology
Software has emerged as the single most consequential pressure point in the private credit market. According to Morgan Stanley data cited by atlaspeakresearch.com, software accounts for approximately 16% ($235 billion) of the $1.5 trillion U.S. loan market, with roughly 50% of those loans rated B- or lower. Private credit exposure to software and services is estimated at around 20% of total AUM (per BNP estimates). Sales growth in the sector has decelerated sharply, from 18% to 10% year-over-year, while equity valuations have fallen approximately 22% since January 2026, mechanically elevating loan-to-enterprise-value ratios and compressing refinancing headroom. The structural driver is the “SaaSPocalypse” thesis: agentic AI tools from Anthropic, OpenAI, and others are threatening the seat-based SaaS model, causing fundamental re-underwriting of enterprise value assumptions. Lenders are responding by widening spreads, tightening covenants, and in many cases simply stepping back from new software originations. Source: investor.wedbush.com.
Under Pressure: Media & Legacy Retail
Traditional media is experiencing a full credit lockout for distressed issuers. Cumulus Media’s second Chapter 11 filing in eight years, restructuring $592 million in debt, is emblematic of a sector where business model disruption has outpaced debt capacity. New Fortress Energy and Trinseo PLC are also navigating creditor negotiations under acute pressure. Lenders with these exposures are now managing workout risk rather than originating new paper. Source: investor.wedbush.com.
Selective Access: Healthcare
Healthcare maintains lender interest but with elevated due diligence on supply chain exposure. The April 2026 anniversary of 100% tariffs on certain branded pharmaceuticals has introduced fresh uncertainty around international sourcing, making lenders particularly cautious on companies with complex cross-border operations. Asset-light healthcare services businesses with predictable cash flows and FCCR above 1.25x continue to attract competitive financing terms. Source: investor.wedbush.com.
Open for Business: Energy, Infrastructure & AI Data Centers
Hard-asset and infrastructure-linked credits are absorbing capital rotating out of software-heavy loan portfolios. Oracle’s $38 billion AI data center debt package and Electronic Arts’ $20 billion Silver Lake-backed buyout financing both demonstrated that cash-flow-positive, asset-anchored credits can still access competitive terms even in a volatile macro environment. Energy infrastructure, particularly power generation tied to data center load growth, is seeing active lender appetite, a structural shift that market participants expect to persist. Source: investor.wedbush.com.
Notably, public corporate bond market liquidity has held up structurally. PIMCO’s analysis of TRACE data confirms that market depth (Amihud illiquidity measure), breadth (turnover ratios), and transaction costs (bid-ask spreads near all-time lows) remain at or near post-GFC bests as of March 2026, reinforcing the view that the stress is concentrated in private credit structures, not public bond markets per se. Source: pimco.com.
Operational & Strategic Implications: What This Means Right Now
For Institutional Investors
The most immediate signal is the pricing dislocation in publicly traded BDCs. With listed vehicles trading at roughly 78 cents on the dollar of reported NAV as of mid-March 2026, versus par just a year ago, the public market is applying a meaningful skepticism discount to private marks. Investors should treat this as both a valuation warning on mark-to-model NAVs and a potential entry signal for disciplined investors in high-quality direct lending vehicles with demonstrably conservative underwriting. Source: atlaspeakresearch.com.
The redemption gate events across BCRED ($3.7B requests, 7.9% of NAV), BlackRock HLEND ($1.2B, 9.3% of NAV), and Cliffwater Corporate Lending Fund (~14% requests, 7% cap) are not isolated liquidity events; they are the first real-world stress test of the semi-liquid perpetual BDC structure. Investors in wealth-channel private credit vehicles must rigorously assess the size and composition of the liquidity sleeve, the proportion of PIK income in reported yields, and the proximity of the portfolio to software and late-cycle 2021–2022 vintage credits. Source: atlaspeakresearch.com.
For Operators & Corporate Borrowers
Borrowers approaching debt maturities in 2026–2027 face a structurally more expensive and more selective refinancing market. New underwriting norms are coalescing around debt-to-EBITDA ceilings of 4.5–5.5x for non-investment-grade credits and mandatory FCCR floors of 1.10x–1.20x with covenant enforcement. Companies carrying floating-rate debt with interest coverage below 1.25x should treat refinancing timeline extension (through asset sales, equity injections, or proactive lender engagement) as a priority operational objective, not a financial planning exercise. Source: atlaspeakresearch.com, marketminute.com.
Forward View: The Next 3–6 Months
The base case for Q2–Q3 2026 is a market that remains open but acutely selective. M&A-driven new-money issuance, the $70 billion in Q1 new-money volume held broadly in line with prior-year levels per sikich.com, will remain the primary engine of deal activity, but concentrated in upper-middle-market and investment-grade credits. The pipeline of deals carried over from late-2025 announcements will thin, and with private equity deal formation slowing, headline volume is unlikely to recover meaningfully before Q4 2026 absent a Fed pivot.
The critical systemic risk is not a generalized solvency event but a liquidity freeze in the middle market. If major semi-liquid private credit vehicles continue to gate redemptions, the resulting asset sales could create secondary-market price discovery that forces broader NAV markdowns, triggering further outflows in a self-reinforcing cycle. The distressed opportunity, however, is real: Oaktree’s record $16 billion distressed fund raise and Apollo’s outperformance signal that disciplined capital is positioning for workout and rescue financing opportunities at double-digit all-in yields for the right credits. Source: marketminute.com.
For the credit market broadly, the watchword through mid-2026 is selectivity enforced by data. Sector, vintage, leverage multiple, coverage ratio, and structure type now determine access and pricing more decisively than at any point in the post-2008 cycle. The lenders and investors who internalized that discipline before the cycle turned are now setting the terms.
Key Market Insights
- Underwriting standards are resetting in real time: Debt-to-EBITDA ceilings are compressing from 6.0–7.0x to 4.5–5.5x for non-investment-grade credits; FCCR floors of 1.10–1.20x are now being covenant-enforced rather than projected.
- Software credit is the systemic pressure point: With 7.4x average leverage, 22% equity drawdown since January, and ~20% exposure across private credit portfolios, software name deterioration poses the broadest mark and default risk for private lenders through 2027.
- PIK income is masking real credit stress: Bad PIK reaching 6.4% of private debt volume in Q1 2026 is a leading indicator of hard defaults to come, investors should discount reported BDC yields that rely heavily on PIK accruals.
- Public corporate bond liquidity is structurally sound: PIMCO’s TRACE-based data shows depth, breadth, and transaction costs at post-GFC bests, the liquidity risk is concentrated in private semi-liquid structures, not public bond markets.
- Capital is rotating to hard assets and distressed strategies: Energy infrastructure, AI data center financing, and distressed/rescue capital are the three categories attracting active lender appetite, operators and investors outside these categories face materially higher cost and friction to close deals.


