
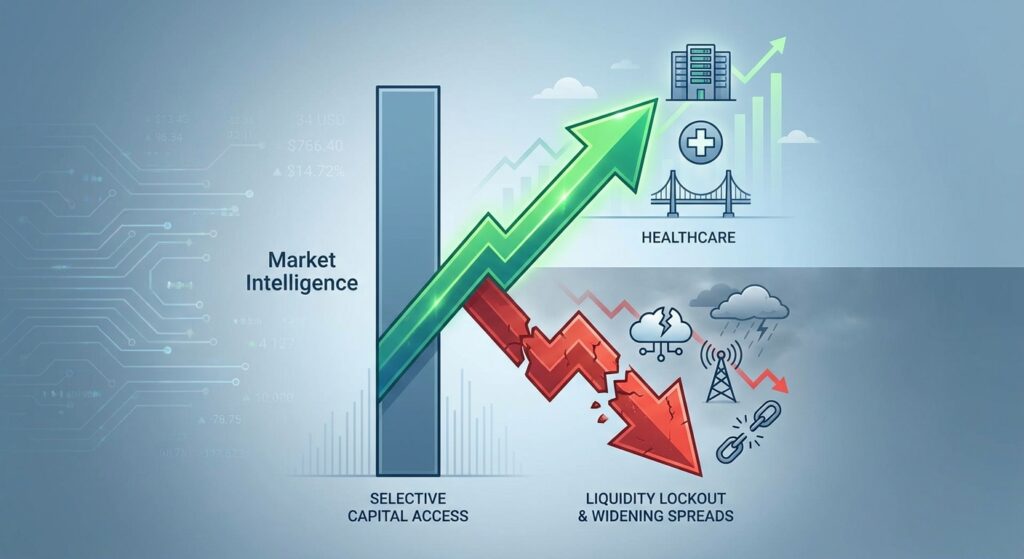
The Macro Headline: A K-Shaped Credit Regime Takes Hold
The first quarter of 2026 has delivered an unambiguous verdict: the era of indiscriminate credit availability is over. Total U.S. leveraged loan primary activity, including repricings, reached approximately $241 billion in Q1 2026, running 32–34% below the prior year’s pace, marking the slowest opening quarter for credit markets since the pandemic shock of 2020, according to sikich.com and investor.wedbush.com.
What makes this contraction structurally significant, rather than merely cyclical, is its shape. This is not a broad market freeze. It is a K-shaped bifurcation: investment-grade and upper-BB-rated borrowers continue to access capital at manageable costs, while the bottom tier of the credit stack (particularly lower-rated software-exposed and media issuers) confronts a near-total liquidity lockout. Macro headwinds driving the divergence include a Federal Reserve rate-cut pause triggered by oil-price-driven inflation, persistent geopolitical instability, and the structural disruption of AI on software-sector valuations. The result is a credit environment defined by a single operating principle: selectivity over volume.
Quantitative Market Snapshot
| Metric | Current Level (Q1 2026) | Prior Period | Source |
|---|---|---|---|
| Total U.S. Leveraged Loan Issuance (incl. repricings) | ~$241B | ~$355B (Q1 2025) | sikich.com |
| New-Money Leveraged Loan Issuance | ~$70B | Modestly below Q1 2025; above 2-yr quarterly avg | sikich.com |
| Middle-Market Unitranche Spreads | SOFR + ~550 bps (est., widened ~100 bps Feb–Mar) | SOFR + ~450 bps (Q4 2025) | mondaq.com / sikich.com |
| Single-B BSL Loan Spreads (late 2025 baseline) | SOFR + ~319 bps (late 2025 baseline; widened materially since) | ~SOFR + 270 bps (early 2025) | mondaq.com |
| High-Yield Bond Spread (B-rated) | ~3.17% OAS (Mar 2026) | ~2.65% OAS (Dec 2025); widened 100+ bps for B-rated credits | investor.wedbush.com |
| U.S. Private Credit Default Rate | 9.2% (Fitch, full-year 2025 record) | 8.1% (2024) | atlaspeakresearch.com |
| Leveraged Loan Distress Ratio (trading <80 cents) | 7.23% (March 2026) | ~4% (Q3 2025 est.) | investor.wedbush.com |
| Public BDC Price / Reported NAV | ~78 cents on the dollar (Mar 12, 2026) | ~85 cents (Jan 2026); ~par (early 2025) | atlaspeakresearch.com |
| Software Sector Avg. Leverage (private credit borrowers) | 7.4x EBITDA | 5.9x (broader loan pool avg.) | atlaspeakresearch.com |
Data as of April 2026. Sources cited above. All figures are market estimates from third-party research and should not be used as a sole basis for investment decisions.
Sector Analysis: Where Lenders Are Leaning In, and Pulling Back
🔴 Software & SaaS: The Sector Lenders Fear Most
Software has emerged as the singular pressure point of the 2026 credit cycle. According to atlaspeakresearch.com (citing Morgan Stanley and KBRA data), software accounts for approximately 16% (or $235 billion) of the $1.5 trillion U.S. loan market. Critically, roughly 50% of software loans carry B- or lower ratings, average leverage sits at a precarious 7.4x EBITDA versus 5.9x across the broader pool, and 30% of the cohort faces maturities by 2028. Revenue growth has decelerated sharply, from 18% year-over-year to 10%, as the emergence of agentic AI tools from Anthropic and OpenAI disrupts traditional SaaS seat-based revenue models. With software equities down roughly 22% since January 2026, loan-to-enterprise-value ratios have risen materially, compressing refinancing headroom and making lenders deeply cautious about new software exposure. Private credit funds with heavy software concentrations, BlackRock’s HLEND (19% software) is a notable example, are facing the sharpest redemption pressure.
🟡 Healthcare & Infrastructure: Selective Demand Persists
Healthcare and infrastructure remain the relative safe harbors of the 2026 credit landscape. M&A financing for cash-flow-positive, asset-backed healthcare businesses demonstrated resilience: Hologic’s $7.25 billion loan pricing successfully cleared the market despite Q1 volatility, per investor.wedbush.com. Energy and infrastructure lenders are receiving increased inbound interest as capital rotates out of software-heavy loan portfolios into hard-asset industries with commodity price tailwinds. However, pharmaceutical supply chains face rising uncertainty following the April 2026 anniversary of 100% tariffs on branded pharmaceuticals, adding complexity to healthcare underwriting for companies with significant international procurement exposure.
🟢 AI Infrastructure & Data Centers: The Upper Arm of the K
AI-adjacent infrastructure remains the most reliably liquid corner of the credit market. Oracle’s $38 billion debt package for AI data center expansion priced successfully, demonstrating that investment-grade, large-cap borrowers with visible infrastructure cash flows can still access deep, liquid markets, per investor.wedbush.com. This is consistent with the macro sector rotation: capital is flowing toward hard assets and AI infrastructure, and away from software and traditional media.
🔴 Media & Legacy Issuers: Liquidity Lockout
Legacy media represents the lower arm of the K. Cumulus Media’s second Chapter 11 filing in eight years, to restructure $592 million in debt, is emblematic of the sector’s existential credit challenge. For these issuers, high-yield spreads above 3.17% represent a prohibitive cost of capital, per investor.wedbush.com.
Structural Shift: The Retailization Risk in Private Credit
Beneath the sector-level dynamics lies a structural fault line that is reshaping private credit’s operational risk profile. The rapid growth of semi-liquid, wealth-channel private credit vehicles (perpetual BDCs and evergreen interval funds) has introduced classic liquidity mismatch at scale. FSOC data cited by atlaspeakresearch.com shows that semi-liquid perpetual BDCs more than tripled in size from end-2021 to Q2 2024. Q1 2026 has served as the first meaningful real-world stress test of this structure:
- Blackstone BCRED received $3.7 billion in redemption requests (~7.9% of NAV), requiring sponsor injection of $400 million and a temporary gate increase to 7%, per atlaspeakresearch.com.
- BlackRock HLEND received $1.2 billion in requests (~9.3% of NAV) with only $620 million paid out, hitting the 5% redemption cap.
- Cliffwater Corporate Lending Fund saw approximately 14% of NAV in redemption requests, capped at 7%.
- Blue Owl sold $1.4 billion in assets across three funds and permanently removed the quarterly withdrawal option from one vehicle.
Simultaneously, public markets are pricing in skepticism about reported NAVs: listed BDCs traded at an average of 78 cents on the dollar of reported assets as of March 12, 2026, down from roughly par in early 2025, signaling that public investors are applying material haircuts to mark-to-model valuations, per atlaspeakresearch.com. The U.S. private-credit default rate reached a record 9.2% in 2025 (Fitch), with double-digit defaults for borrowers with less than $30 million EBITDA, per atlaspeakresearch.com. The rising share of payment-in-kind (PIK) income in BDC portfolios adds further opacity: PIK can preserve reported yield optics while masking underlying borrower deterioration.
Implications for Institutional Investors & Business Operators
For Institutional Investors
The 22-cent NAV discount on public BDCs versus reported marks is the market’s clearest signal: valuation credibility is now a selection criterion, not a given. Investors conducting due diligence on private credit allocations should scrutinize software sector concentration, PIK income as a percentage of total BDC yield, liquidity sleeve composition (leveraged loans vs. true private credit), and redemption gate mechanics before committing capital. Vehicles with 10–40% liquidity sleeves in marketable instruments are structurally more vulnerable to synchronized withdrawal requests than closed-end institutional vehicles whose capital lockups match loan durations. For those with dry powder, the dislocation is creating selective entry points: distressed loan prices, widened spreads, and forced asset sales from gates-constrained vehicles may offer opportunities for patient, long-duration capital, particularly in healthcare and infrastructure credits that have been indiscriminately marked down alongside software-heavy portfolios.
For Business Operators & Borrowers
The underwriting environment has shifted decisively. Lenders are now applying tighter FCCR thresholds (with coverage ratios of 1.25x or better increasingly required even for sponsored credits) and are scrutinizing leverage multiples with renewed discipline. Software borrowers at 7.4x EBITDA face a structurally harder refinancing path than 12 months ago. Operators with approaching debt maturities in 2026–2027 should treat the current window as operationally urgent: the combination of elevated base rates, wider spreads, and tightening lender appetite means that rescue financing, if required, will likely be available only at materially higher all-in costs, potentially double-digit rates, per investor.wedbush.com. Operators with strong free cash flow generation, hard asset collateral, and sub-5x leverage remain well-positioned to access capital, even in a tighter market.
Forward-Looking View: The Next 3–6 Months
The base case for Q2–Q3 2026 is continued credit bifurcation, with the primary market remaining open but selective. As noted by sikich.com, refinancing progress against upcoming maturities has slowed materially for lower-rated credits, and maturity pressure is becoming concentrated among the weakest borrowers with limited near-term relief options. If the Federal Reserve remains on hold, as an oil-price-driven inflation shock constrains its easing path, the market’s “higher for longer” dynamic will keep pressure on floating-rate borrowers carrying minimal interest rate hedges, a structural vulnerability Fitch explicitly flagged for the private credit market. The key tail risk to watch: if redemption gates at major semi-liquid private credit vehicles persist or accelerate, forced asset sales could depress secondary loan prices and trigger a broader markdown cycle, a scenario in which the 7.23% distress ratio could move materially higher. Conversely, any Fed pivot or oil price normalization could rapidly reopen the primary market for the second tier of borrowers currently locked out. For now, the watchword is selectivity, and the data suggests that word will define credit markets well into the second half of 2026.
Key Market Insights
- Volume collapse is concentrated, not systemic: The 32–34% drop in Q1 2026 leveraged loan issuance is driven by a collapse in refinancings and repricings, not a failure of new-money deal financing, which held relatively stable, per sikich.com.
- Spread widening is sector-specific, not universal: Investment-grade spreads remain anchored while B-rated credit spreads have widened 100+ basis points: operators and investors must price risk by tranche and sector, not by market headline, per investor.wedbush.com.
- Software sector leverage is the cycle’s Achilles heel: At 7.4x EBITDA with slowing growth and equity values down 22%, software credits face a compressing refinancing window that will intensify through 2026–2028 maturities, per atlaspeakresearch.com.
- Retailized private credit structures are under structural stress: The Q1 redemption wave at BCRED, HLEND, Cliffwater, and Blue Owl represents the first real stress test of wealth-channel private credit liquidity promises, and the results demand structural reassessment.
- Valuation opacity is becoming a cost of capital: The 22-cent NAV discount on public BDCs signals that the market is no longer accepting mark-to-model valuations at face value, transparency and portfolio quality are now priced into access and cost of capital, per atlaspeakresearch.com.


