
Why the Space Between Debt and Zero Matters More Than the Rate
When most people evaluate a private credit investment, they fixate on the yield: the spread over SOFR, the all-in coupon, the fee income. Those numbers matter. But experienced lenders will tell you the yield is the reward. The equity cushion is the protection. Understanding the difference between the two is the foundation of sound private credit underwriting.
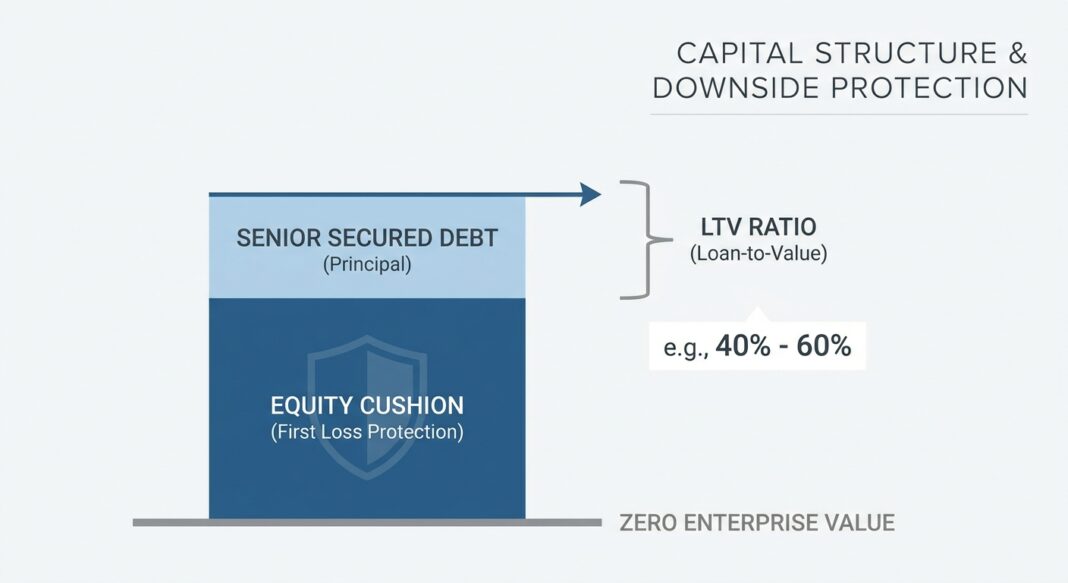
At its core, private credit is a lending business. Senior secured lenders do not share in the upside when a company grows; they earn a fixed income stream and expect their principal back. What protects that principal is not the company’s growth trajectory; it is the buffer of equity sitting beneath the debt in the capital structure. That buffer, commonly measured through the loan-to-value (LTV) ratio: determines how much enterprise value can erode before the lender’s position comes under pressure.
In today’s market, where bank lending standards have continued to tighten and private credit has stepped into an expanding share of middle-market financing, the equity cushion has become the most scrutinised metric in credit underwriting. This article explains exactly how LTV protection works, why it matters to both investors and operators, and what current market data tells us about the health of that cushion today.
What Is the Equity Cushion and How Does LTV Measure It?
The loan-to-value ratio is the percentage of a company’s enterprise value (or asset value) that is financed by debt. It is calculated as:
LTV = Total Debt ÷ Enterprise Value
The inverse, (1 − LTV), is the equity cushion: the portion of the company’s value that belongs to equity holders and must be wiped out before lenders begin to absorb losses.
Consider a straightforward illustration. If a private equity sponsor acquires a business for $100 million and finances the deal with $50 million of senior secured debt and $50 million of equity, the LTV at origination is 50%. That means enterprise value would need to fall by more than 50%, from $100 million to below $50 million, before the lender’s principal is impaired.
This buffer matters enormously in stress scenarios. Companies encounter revenue slowdowns, margin compression, and adverse market cycles. The equity cushion is what absorbs those shocks first. Equity investors lose before lenders lose. This is the structural logic behind the phrase senior secured: the lender is senior in priority (paid first) and secured against collateral (backed by assets or enterprise value).
A lower LTV means a larger equity cushion and, generally, a stronger protective position for the lender. A higher LTV compresses that cushion and increases the sensitivity of the lender’s recovery to any deterioration in business performance or market value.
A Worked Example: The Math Behind the Protection
Imagine a private credit fund is evaluating two transactions on the same day, each involving a $120 million enterprise value business. Both carry the same 550 basis point spread over SOFR. The only difference is the capital structure:
- Deal A: $72 million of senior secured debt. LTV = 60%. Equity cushion = 40%.
- Deal B: $90 million of senior secured debt. LTV = 75%. Equity cushion = 25%.
Now apply a stress scenario: the company’s enterprise value declines 35% to $78 million, a realistic outcome in a cyclical downturn or a valuation re-rating.
- Deal A at stress: $78 million enterprise value vs. $72 million debt. The lender still has ~8% coverage. Principal is protected.
- Deal B at stress: $78 million enterprise value vs. $90 million debt. The lender is now underwater by $12 million. A 35% business decline has fully impaired the loan.
Same yield. Same borrower quality on paper. Vastly different risk profiles. This is why LTV at origination is the single most consequential structural variable a private credit lender controls. The coupon compensates for time and credit risk; the LTV determines the recovery in a loss scenario.
As Lord Abbett (June 2026) notes, a lower loan-to-value means the lender is advancing a smaller portion of the company’s value, which can provide a cushion if operating performance weakens or market valuations decline.
Current Market Reality: What the Data Shows in 2026
The good news for private credit investors is that current market data suggests equity cushions remain meaningful and underwriting discipline has held. The following data points paint a clear picture:
| Metric | Current Data Point | Source |
|---|---|---|
| Senior secured LTV range, private credit | 40%–60% (mid-market direct lending) | LPL Research, Mar 2026 |
| Average LTV, Morgan Stanley direct lending portfolio | ~40% LTV (implying ~60% equity cushion) | Morgan Stanley IM, 2026 |
| Average LBO equity contribution at origination (2025) | ~50%, up from ~35% in 2013 | Partners Group, May 2026 |
| Average equity contribution, US BSL buyouts (YTD 2025) | 46%, down from 51% peak in 2023 | PitchBook LCD, Sep 2025 |
| Cliffwater Direct Lending Index (CDLI) return, full year 2025 | 9.3%, with 20-year average of 9.5% | Cliffwater LLC, Mar 2026 |
| Bank C&I lending standards, Q1 2026 (Fed SLOOS) | Tighter standards for firms of all sizes | Federal Reserve SLOOS, Apr 2026 |
| Private credit non-accrual rate, Q4 2025 | ~1.3% of cost, below post-GFC average | Partners Group, May 2026 |
The structural backdrop reinforces why equity cushions matter right now. The Federal Reserve’s April 2026 SLOOS reported that banks tightened lending standards for commercial and industrial loans to firms of all sizes in Q1 2026, continuing a trend of constrained bank credit availability. As banks pull back, businesses increasingly turn to private credit lenders: who, because they are not operating under bank regulatory leverage constraints, can engage with more complex capital structures. But that flexibility comes with a responsibility: disciplined LTV underwriting is the primary safeguard.
Partners Group (May 2026) notes that average equity contributions at LBO origination have increased steadily over the past decade, with the average moving from approximately 35% in 2013 to around 50% today, meaning sponsors are putting substantially more of their own capital at risk ahead of the lender’s position. That shift directly enlarges the equity cushion beneath private credit loans.
Meanwhile, Heron Finance’s Q2 2026 Private Credit Benchmark Report confirms that LTV ratios have remained conservative across segments, with stable readings indicating that lenders have not materially loosened underwriting standards over the past three years.
Decision Framework: Investors and Operators
For Investors Evaluating Private Credit
When reviewing a private credit fund or direct lending opportunity, the equity cushion analysis should form the backbone of due diligence. Investors consider the following:
- Ask for weighted average LTV at origination across the portfolio, not just the headline yield. A fund offering 11% gross yield on 75% LTV paper may carry materially more principal risk than one offering 9.5% on 50% LTV paper.
- Track LTV drift over time. As company valuations shift, LTVs move. A portfolio with rising LTVs (without corresponding performance improvement) signals eroding protection.
- Distinguish between asset-backed LTV (hard assets) and enterprise value LTV (cash flow businesses). Enterprise value LTV can deteriorate sharply if EBITDA falls and valuation multiples compress simultaneously, a double hit that the 2022–2023 environment illustrated clearly.
- Look beyond the senior layer. In unitranche structures, lenders technically hold a single blended instrument but the effective LTV still determines how much subordination exists relative to enterprise value. Understand what you own.
For Business Operators Seeking Capital
For operators, the equity cushion concept reframes how private credit lenders think about risk, and therefore how operators can position their capital raise:
- Lenders price risk, not just rate. A business with strong, stable EBITDA and hard-asset collateral will command a lower spread (and more favorable terms) because the effective LTV protection is stronger even at higher loan amounts.
- Equity contribution signals commitment. Sponsors who put more equity into a deal reduce the lender’s LTV exposure and signal conviction in the business plan. Operators evaluating PE partnerships should understand how the sponsor structures the capital stack; it affects the lender’s appetite and the cost of debt.
- Asset-light businesses face higher scrutiny. When enterprise value is primarily driven by recurring software revenue or contractual cash flows, rather than physical assets, lenders evaluate downside scenarios more carefully. Demonstrating revenue durability, customer retention, and low churn can support lower LTV underwriting and better pricing.
Key Takeaways
- The equity cushion, not the coupon, is the lender’s true margin of safety. LTV at origination determines how much the business can decline before principal is at risk.
- Current market data shows discipline is holding. Average LTV ratios in direct lending remain in the 40%–60% range, with equity contributions near multi-decade highs, providing meaningful downside protection for senior lenders.
- Bank retrenchment creates opportunity for private credit, but also responsibility. As the Federal Reserve’s SLOOS confirms continued tightening of C&I lending standards, private lenders stepping in must anchor their underwriting to conservative LTV thresholds, not just attractive yields.
- Investors should treat LTV as a portfolio-level metric, not a deal-level checkbox. Aggregate LTV drift, sector concentration in asset-light industries, and vintage exposure to the 2021–2022 low-rate era all influence how much real cushion sits beneath a portfolio today.
- For operators, understanding LTV helps structure better deals. Businesses that can demonstrate stable cash flows, defensible revenue streams, and strong collateral coverage will find private credit lenders more willing to offer larger loan amounts at competitive terms, because the lender’s protective cushion is stronger.


