
The Underwriting Question Every Private Lender Must Answer
Before committing capital to any middle-market borrower, a disciplined private credit lender asks one foundational question: Under what conditions does this loan stop performing, and how far are we from that threshold today?
Cash flow stress testing is the analytical engine that answers that question. It is not a compliance exercise or a box to check in a credit memo. It is the primary mechanism by which a lender converts qualitative business risk into quantifiable downside exposure, and determines whether the proposed debt structure is appropriate for the borrower’s actual risk profile, not the management team’s optimistic projections.
In a private credit market where deal documentation has tightened and lender selectivity has increased, particularly in the large-cap segment, where pgim.com notes that larger-scale borrowers have historically delivered lower defaults and higher recovery rates, the quality of your stress testing framework is a direct determinant of portfolio outcomes.
This article walks through a complete, practitioner-grade methodology for stress testing borrower cash flows, from base case construction to covenant breach analysis, using a representative manufacturing company as the working example.
The Analytical Framework: Three-Scenario Cash Flow Architecture
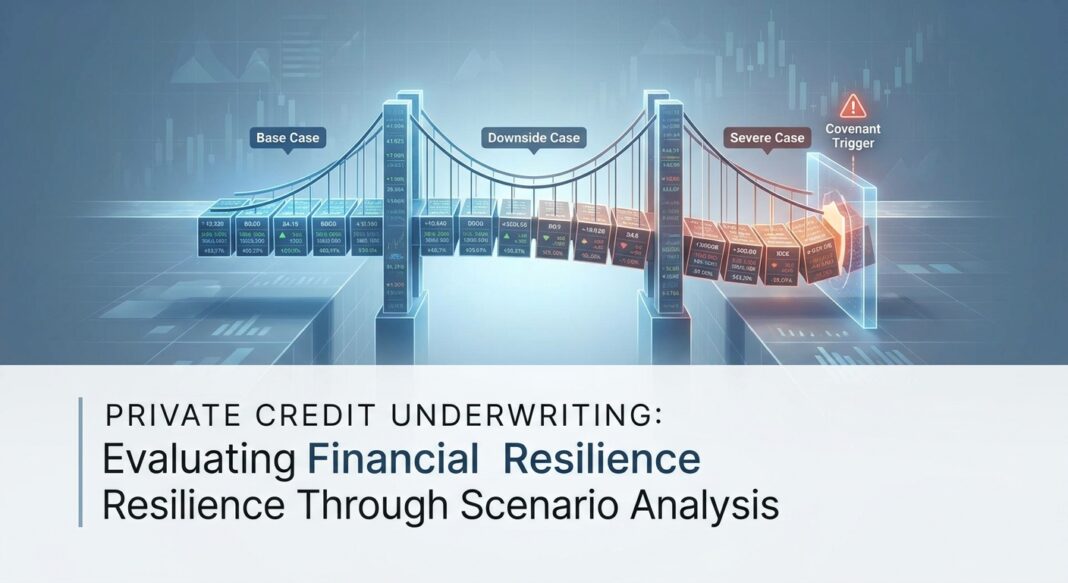
Institutional lenders structure stress testing around three distinct scenarios, each anchored to specific revenue and margin assumptions rather than generalized percentage haircuts. The goal is scenario specificity: each case should reflect a plausible, internally consistent operating environment, not an arbitrary shock.
The Three Scenarios
- Base Case: Management projections, lightly adjusted for lender conservatism. This is the starting point, not the underwriting thesis.
- Downside Case: A cyclical or sector-specific deterioration, typically a 15–25% revenue decline combined with 200–400 basis point margin compression. This should reflect an actual historical analog for the industry.
- Severe Downside / Liquidation Case: A stress scenario calibrated to a recessionary environment or company-specific operational failure. This scenario drives recovery analysis and informs structuring decisions (collateral, guarantee packages, covenant triggers).
Working Example: $10M EBITDA Manufacturing Borrower
Consider a specialty industrial manufacturer with $60M in revenue, $10M in reported EBITDA (16.7% margin), and a proposed $55M senior secured term loan, representing a 5.5x gross leverage multiple at close. The capital structure includes a $10M revolver. Management projects 8% annual revenue growth over a three-year forecast horizon.
A lender applying rigorous stress methodology does not accept the 8% growth assumption as the underwriting anchor. Instead, the lender constructs independent revenue scenarios, validates margin assumptions against industry data, and models free cash flow available for debt service (CFADS) under each case.
Per fitchratings.com Global Corporate Rating Criteria, projections should be developed with a three-to-five year time horizon and benchmarked against at least three years of operating history, enough to capture at least one economic cycle of meaningful performance data.
Walking Through the Calculations
Step 1: Build the Base Case CFADS Bridge
Start with EBITDA, then subtract cash taxes, unfunded capex (maintenance capex only, not growth), changes in working capital, and mandatory debt amortization to arrive at free cash flow available for debt service.
Base Case: $10.0M EBITDA → less $1.2M cash taxes → less $1.8M maintenance capex → less $0.5M working capital build = $6.5M CFADS. Against $4.4M in annual debt service (principal + interest at a hypothetical 8% all-in rate on a 5-year amortizing structure), the Debt Service Coverage Ratio (DSCR) is 1.48x. Acceptable, but not comfortable.
Step 2: Apply the Downside Scenario
A 20% revenue decline (reflecting a sector-specific demand contraction) compresses EBITDA by approximately 35% after operating leverage effects, bringing EBITDA to $6.5M. Applying the same deductions: $6.5M → less $0.7M taxes → less $1.8M capex → less $0.3M working capital release = $3.7M CFADS. DSCR falls to 0.84x: below the 1.0x cash flow break-even threshold and almost certainly breaching the financial maintenance covenant, typically set at 1.10x–1.20x DSCR by institutional lenders.
Step 3: Identify the Covenant Breach Point
Working backward: if the covenant is set at 1.15x DSCR with 25% headroom to the breach, the maximum tolerable EBITDA deterioration before a technical default is approximately 14% from the base case. In this manufacturing example, that translates to roughly a 9–10% revenue decline, a threshold that is frequently breached in cyclical industrial downturns.
This is the critical insight stress testing provides: the covenant triggers before the business runs out of cash, giving the lender an intervention window to restructure or accelerate remediation.
What Institutional Lenders Look For, and Red Flags to Avoid
Credit Performance Benchmarks
Understanding where the market sets standards is essential context for calibrating your own underwriting. Key data points from leading credit research institutions:
📊 Data Reference Points
- Fitch’s corporate rating criteria requires analysis of both historical and projected financial profiles, with qualitative factors (management strategy, governance, business profile) layered on top of quantitative leverage and coverage metrics. Ratings can be capped in sectors exhibiting above-average volatility even when leverage metrics appear acceptable. (fitchratings.com)
- Moody’s Finance Company Methodology assesses cash flow adequacy through FFO/Total Debt, Debt Maturities Coverage, and Secured Debt/Gross Tangible Assets as primary financial profile scorecard inputs, reinforcing the multi-metric approach over single-ratio reliance. (moodys.com)
- The CFA Institute’s credit analysis framework identifies three core inputs to credit risk modeling: expected exposure to default loss, loss given default (LGD), and probability of default (PD), together comprising the Credit Valuation Adjustment (CVA) that determines fair value compensation for bearing credit risk. (cfainstitute.org)
- Large-cap private credit borrowers (EBITDA above $75M) have historically shown lower default rates and higher recovery rates than middle-market peers, attributed to greater revenue diversification, stronger management depth, and tighter security documentation. (pgim.com)
Common Red Flags in Cash Flow Stress Testing
- Management capex is treated as fully discretionary: Lenders frequently allow borrowers to model capex holidays in stress scenarios. In asset-intensive businesses, maintenance capex is largely non-discretionary: cutting it defers, not eliminates, the cash outflow.
- Working capital is ignored: Revenue declines in manufacturing and distribution businesses often release working capital (inventory drawdown), which flatters near-term CFADS in a stress scenario. However, a revenue recovery then requires a working capital rebuild that consumes cash at the worst time.
- Single-point EBITDA used as the stress input: Applying a flat percentage haircut to EBITDA without modeling the revenue and margin drivers independently produces an inaccurate stress picture. Operating leverage means a 20% revenue decline typically produces a 30–40% EBITDA decline in businesses with significant fixed cost structures.
- No covenant-to-cash-flow bridge: A stress test that only shows EBITDA at the bottom of a scenario, without translating it into a DSCR or leverage covenant test, leaves the most actionable insight on the table.
Underwriting Checklist: Cash Flow Stress Testing
- Obtain three years of audited financials plus trailing twelve months (TTM) management accounts. Validate that reported EBITDA bridges cleanly to operating cash flow in the cash flow statement.
- Decompose revenue into volume, price, and mix components. Stress each independently, price compression and volume loss have different margin implications.
- Separate maintenance capex from growth capex in the model. Require the borrower to provide a detailed capex schedule with line-item justifications for all growth spending.
- Map the fixed/variable cost split for the business. High fixed-cost businesses (manufacturing, logistics, healthcare facilities) have steeper EBITDA drop-throughs on revenue declines.
- Model CFADS, not just EBITDA: in all three scenarios. CFADS = EBITDA less cash taxes less maintenance capex less net working capital change less mandatory debt amortization.
- Calculate DSCR and leverage at each scenario and compare against proposed covenant levels. Confirm that the downside scenario triggers covenant protection before cash is exhausted.
- Run a covenant-to-headroom analysis: How many percentage points of revenue decline are required to breach each financial maintenance covenant? Is that threshold realistic given the company’s industry cycle history?
- Document the stress testing rationale in the credit memo with explicit industry analogs: prior cycle downturns, comparable company performance data, or sector-specific demand volatility statistics.
Key Takeaways
- 📌 Stress testing is structuring intelligence: A well-constructed downside scenario tells you where to set covenant thresholds, not just whether to approve the loan.
- 📌 CFADS beats EBITDA as the underwriting metric: Free cash flow available for debt service is the only number that tells you whether the borrower can actually service the debt, EBITDA is a starting point, not the conclusion.
- 📌 Operating leverage is the hidden multiplier: In fixed-cost-heavy businesses, a 20% revenue decline can produce a 35–40% EBITDA decline. Build this into your revenue-to-margin bridge explicitly.
- 📌 Covenant breach should precede cash exhaustion: Covenants exist to give lenders an intervention window. If your stress scenario shows covenant breach after the borrower runs out of cash, the covenant structure is mis-designed.
- 📌 Institutional standards demand multi-cycle perspective: Per Fitch and Moody’s rating methodologies, credit analysis should span at least one full economic cycle of operating history, typically three to five years, before projections can be credibly stress-tested against that baseline.


