
The Question Every Underwriter Must Answer Before Closing
When a $10M EBITDA manufacturing company walks through your door seeking a $35M term loan, the base case always looks compelling. Revenue is growing, margins are stable, and management projects 8% top-line expansion for the next three years. The real underwriting work begins when you break it.
Stress testing cash flows is not a formality. It is the central discipline that separates disciplined private credit underwriting from yield-chasing capital deployment. As private credit has scaled toward a $3 trillion asset class, structural erosion (covenant-lite documentation, retroactive PIK conversions, and aggressive EBITDA normalization) has made rigorous stress analysis more essential than ever. According to reporting tracked by ainvest.com, the share of “bad PIKs”, retroactive conversions of cash interest to Payment-In-Kind, surged from 36.7% in Q4 2021 to 57.2% by Q3 2025, a signal that borrower cash generation is under persistent pressure. When cash flows are impaired, your stress test is the last line of defense.
The Analytical Framework: Three Scenarios, One Credit Decision
A credible stress testing framework is built around three distinct cash flow scenarios applied to the same borrower, each calibrated to a realistic but adverse set of operating assumptions. The goal is not to engineer a pass; it is to discover the precise conditions under which the borrower cannot service its debt.
Scenario Architecture
- Base Case: Management projections stress-tested against trailing 12-month (LTM) actuals. Use LTM EBITDA, not forward projections, as your anchor.
- Downside Case: Apply a 15–20% revenue decline and a 200–300 bps margin compression. This approximates a moderate recession or sector-specific demand shock.
- Severe Downside Case: Apply a 30–35% revenue decline with a further 400–500 bps margin contraction and a simultaneous working capital outflow of 3–5% of revenue. This approximates a cyclical trough or a credit event at a key customer.
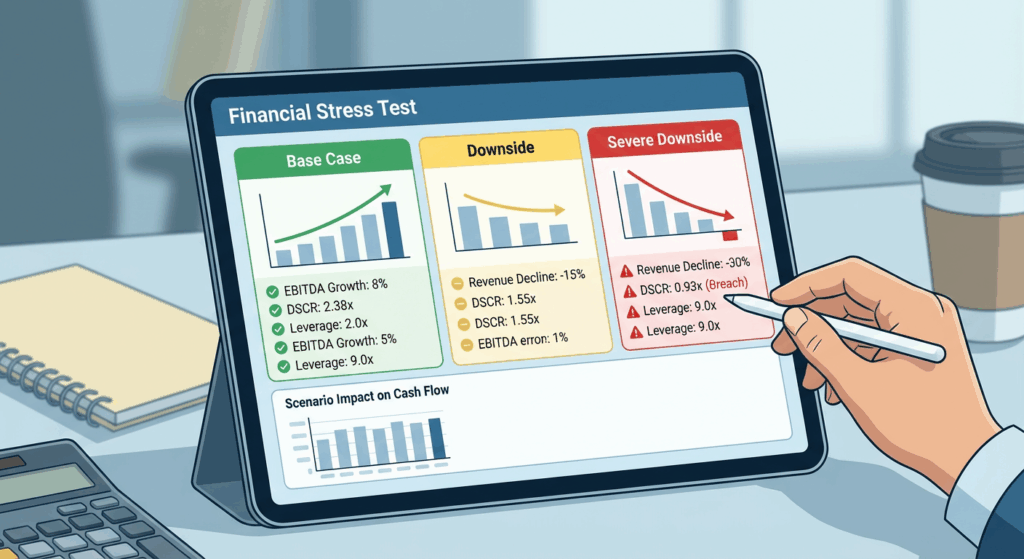
For our $10M EBITDA manufacturer with $35M in term debt (3.5x leverage), the framework looks like this:
| Metric | Base Case | Downside | Severe Downside |
|---|---|---|---|
| Revenue | $65M | $52M (–20%) | $43M (–34%) |
| EBITDA Margin | 15.4% | 12.5% | 9.0% |
| EBITDA | $10.0M | $6.5M | $3.9M |
| Annual Debt Service (P+I) | $4.2M | $4.2M | $4.2M |
| DSCR | 2.38x | 1.55x | 0.93x |
| Leverage (Debt / EBITDA) | 3.5x | 5.4x | 9.0x |
Illustrative example for analytical instruction only. Not derived from any specific borrower.
The severe downside scenario reveals a DSCR below 1.0x, the borrower cannot cover debt service from operating cash flows. At 9.0x leverage, refinancing is not a realistic exit. This is precisely the scenario where PIK conversions begin, covenant waivers are requested, and recovery analysis becomes the operative framework.
Walking the Calculations: What the Numbers Are Actually Telling You
Three metrics govern every cash flow stress test at the instrument level. Each must be calculated on a trailing, forward, and stressed basis, never just one vintage.
1. Debt Service Coverage Ratio (DSCR)
DSCR = (EBITDA – Capex – Cash Taxes – Working Capital Change) ÷ Total Debt Service. A DSCR below 1.20x in the base case should require a credit committee explanation. Below 1.0x in the downside case signals a structural problem, not a temporary one. Fitch Ratings explicitly evaluates coverage ratios (including DSCR and gross interest coverage) as core quantitative metrics across infrastructure, project finance, and corporate credit assessments.
2. Leverage Ratio (Debt / EBITDA)
The leverage ratio is your primary impairment signal under stress. A borrower that enters a downside scenario at 3.5x can breach 5.5x leverage within a single fiscal year without any new borrowings. At that level, sponsor equity is functionally impaired, and lender recoveries begin to depend on collateral rather than enterprise value. Moody’s Analytics portfolio modeling framework anchors on probability of default (PD), loss given default (LGD), and exposure at default (EAD) as the foundational trio, all three are materially sensitive to where the leverage ratio lands under stress.
3. Fixed Charge Coverage Ratio (FCCR)
FCCR = (EBITDA – Capex – Cash Taxes) ÷ (Interest Expense + Scheduled Principal + Lease Payments). This is the covenant-level metric most frequently embedded in credit agreements and the first trigger that fires when a borrower deteriorates. Setting the maintenance covenant at 1.10x in base versus 1.0x minimum gives lenders 90–120 days of early warning before a payment default occurs, assuming the covenant is maintenance-tested quarterly, not incurrence-only.
What Institutional Lenders Require: Standards and Red Flags
Large-cap private credit platforms operating at institutional scale consistently apply more rigorous underwriting documentation than middle market peers. PGIM’s large cap private credit framework identifies tighter security documentation and more favorable fundamental screens (including scale, revenue resilience, and experienced management) as the primary drivers of lower defaults and higher recovery rates at the upper end of the market.
Fitch’s rating methodology for corporates explicitly measures cash flow and earnings quality through EBITDA-based profitability, leverage, and coverage ratios: evaluated not in isolation but against sector volatility, competitive intensity, and management quality.
Red Flags That Stress Tests Surface
- Margin-dependent DSCR: If DSCR only works at EBITDA margins above the trailing 5-year average, the credit is priced on a best-case scenario, not a through-the-cycle scenario.
- Working capital seasonality ignored: Many manufacturing and distribution borrowers have 60–90 day peak working capital draws. A stress test that ignores seasonal cash deployment will overstate liquidity by 10–20%.
- Capex treated as discretionary: Maintenance capex is non-negotiable. Underwriters who allow borrowers to cut capex to zero in a stress scenario are modeling a business in liquidation, not a going concern.
- Retroactive PIK tolerance: As ainvest.com reports citing Lincoln International data, bad PIKs now comprise a majority of PIK conversions, a direct signal that lenders are absorbing cash shortfalls rather than surfacing them through covenant enforcement.
- Covenant-lite erosion: Incurrence-only covenants in leveraged middle market deals remove the early warning system. Maintenance covenants must be tested quarterly at a minimum.
Underwriting Checklist: Cash Flow Stress Testing
- Anchor to LTM actuals. Require audited or quality-of-earnings-adjusted financials for at least three full fiscal years plus the trailing twelve months. Never underwrite to projected EBITDA without a QoE report.
- Build all three scenarios independently. Do not derive downside from base as a percentage haircut, rebuild the P&L from revenue line down using sector-specific demand elasticity assumptions.
- Calculate DSCR, FCCR, and Leverage in each scenario. Document the exact level at which each covenant would be breached. Map that to a timeline.
- Stress working capital separately. Model a receivables extension of 15–30 days and an inventory build of 10–15% of COGS as a simultaneous adverse event.
- Validate maintenance capex independently. Request the last three years of capex schedules. Separate maintenance from growth capex. Apply maintenance as a fixed cash charge in all scenarios.
- Test the refinancing assumption. At peak stressed leverage, would this borrower have access to capital markets or bank credit? If not, your exit depends on collateral recovery, model it explicitly.
- Document your stress assumptions and have them reviewed. Every assumption in the downside and severe downside scenarios should be defensible with sector data, comparable credit history, or rating agency guidance. Reference Moody’s Analytics correlation and credit migration data where applicable.
- Set covenant levels off stressed, not base, metrics. FCCR maintenance covenant should provide at least 15–20% headroom from the downside case FCCR, not the base case.
Key Takeaways
- 🔴 Never underwrite to the base case. The base case tells you what the borrower earns when everything works. The severe downside tells you whether your capital is recoverable when it doesn’t.
- 📉 DSCR below 1.20x in base is a structural risk signal, not a pricing opportunity. Below 1.0x in any stressed scenario requires a collateral recovery thesis before proceeding.
- ⚠️ Retroactive PIK conversions are a lagging default indicator. A portfolio with rising PIK exposure is one where stress has already materialized, the cash shortfalls are simply being deferred, not resolved.
- 🏗️ Covenant design must be calibrated to the stress test, not the base case. Maintenance FCCR and leverage covenants set on optimistic projections provide no early warning value to lenders.
- 📋 Documentation and diligence quality correlate directly with recovery rates. Large-cap lenders with tighter security documentation and rigorous fundamental screens consistently demonstrate lower defaults and stronger recoveries than covenant-lite middle market peers.


