
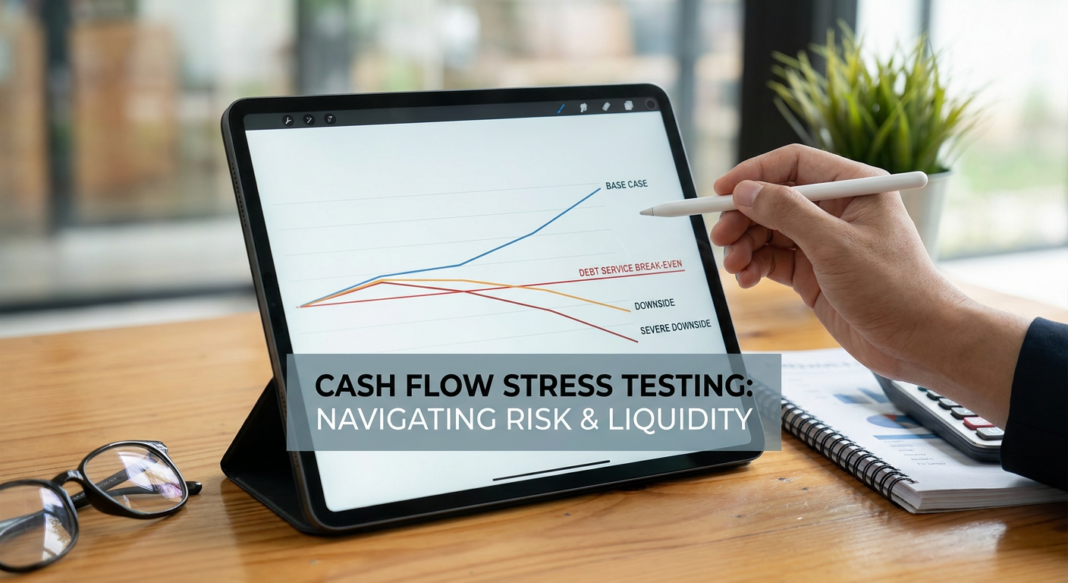
The Underwriting Challenge: When the Base Case Is the Best Case
Here is the scenario every credit desk should fear: a borrower’s Confidential Information Memorandum (CIM) projects 12% EBITDA growth over three years, leverage sits at 4.5x on a trailing basis, and the sponsor argues the business is recession-resilient. The deal prices at SOFR + 550 bps, the syndication closes oversubscribed, and eighteen months later the company is in a forbearance agreement.
What went wrong? In the vast majority of middle-market credit failures, the root cause is not a black-swan event; it is a base case underwrite that was never stress-tested. Lenders accepted management projections without building an independent downside scenario, failed to model working capital cyclicality, and structured covenants with so much headroom they offered no early-warning signal.
Cash flow stress testing is the discipline that closes that gap. It forces underwriters to answer one foundational question before committing capital: Under what conditions does this borrower run out of money, and how fast does that happen? This article lays out the analytical methodology, the key metrics, and the red flags that experienced private credit lenders use to answer that question rigorously.
The Analytical Framework: Three-Scenario Cash Flow Modeling
Institutional lenders typically build three independent cash flow scenarios (Base, Downside, and Severe Downside) each driven by distinct macroeconomic and operational assumptions. The goal is not to predict the future but to identify the break-even leverage threshold and the time-to-liquidity-crisis under stress.
Step 1: Normalize and Anchor EBITDA
Before any scenario modeling, EBITDA must be normalized. Strip out one-time items, management add-backs that lack documentation, and any pro forma synergies not yet realized. For a manufacturing company reporting $10 million in adjusted EBITDA, a disciplined underwriter might find $1.2–1.8 million in add-backs that are recurring in nature, effectively reducing the underwritable EBITDA to $8.2–8.8 million before a single downside assumption is applied.
Key anchoring metrics at this stage:
- LTM EBITDA vs. Budget EBITDA: A persistent gap between actuals and budget is itself a red flag on management’s forecasting credibility.
- EBITDA Margin Trend (3-year): Is margin expanding, contracting, or volatile? Volatility above ±200 bps annually in a non-cyclical sector warrants a more severe downside assumption.
- Gross-to-Net EBITDA Conversion: High gross margin with low EBITDA margin signals fixed-cost leverage that will amplify revenue declines in a downturn.
Step 2: Build the Three Scenarios
Using the normalized EBITDA as the starting point, model each scenario across a 24–36 month horizon:
- Base Case: Management projections haircut by 10–15% on revenue growth, capex held flat or modestly elevated.
- Downside: Revenue declines 10–15% from LTM, EBITDA margins compress 150–250 bps, working capital draws on revolver by 20–30% of availability.
- Severe Downside: Revenue declines 20–25% (consistent with a moderate recession scenario), margins compress 300–400 bps, capex cuts constrained by maintenance requirements, revolver fully drawn.
Example: For our $10M EBITDA manufacturer with $45M of senior secured debt (4.5x leverage), a 20% revenue decline and 300 bps of margin compression produces EBITDA of approximately $6.8M. Debt service on a term loan at SOFR + 500 bps (roughly 10.3% all-in as of mid-2026) equals approximately $4.6M annually. That leaves a Debt Service Coverage Ratio (DSCR) of 1.48x: still technically serviceable, but with no room for working capital absorption, capex, or covenant compliance cushion.
Walking Through the Calculations: DSCR, FCF Conversion, and Liquidity Runway
Debt Service Coverage Ratio (DSCR)
DSCR = (EBITDA − Cash Taxes − Maintenance Capex) ÷ (Cash Interest + Scheduled Amortization)
Institutional direct lenders typically require a minimum DSCR of 1.15x–1.25x in the base case and underwrite to a floor of 1.0x in the severe downside. A DSCR below 1.0x in the downside scenario is a hard no for most senior secured strategies without significant structural mitigants.
Free Cash Flow Conversion Rate
FCF Conversion = (EBITDA − Capex − Cash Taxes − Cash Interest − Working Capital Change) ÷ EBITDA
A conversion rate below 50% in the base case, before amortization, signals that the business is capital-intensive or has structural cash leakage. For the manufacturing example, if maintenance capex runs $1.5M, taxes $0.8M, and working capital absorbs $0.5M annually, the company converts approximately 72 cents of every EBITDA dollar to free cash flow in the base, but that drops to 58 cents in the downside once margin compression is applied. That delta matters enormously for amortization serviceability.
Liquidity Runway
Model the number of months the company can sustain operations under the severe downside before exhausting its revolver and cash reserves. A runway of fewer than 6 months under the severe downside should trigger structural protections: tighter covenant thresholds, a springing cash sweep, or a larger revolver commitment relative to drawn term debt.
What Institutional Lenders Look For, and Where Deals Break Down
Private credit has grown into a multi-trillion-dollar asset class, and with that growth has come increasing scrutiny on underwriting discipline. Several data points frame current market standards:
- According to moodys.com, the trailing twelve-month default rate for U.S. speculative-grade issuers has remained elevated in 2025–2026 relative to the 2021–2022 trough, underscoring the importance of conservative underwriting in the current rate environment.
- spglobal.com research on leveraged loan recovery rates indicates that senior secured first-lien lenders in middle-market transactions have historically recovered in the 60–75% range at the mean, but recovery rates compress sharply when leverage at origination exceeds 5.0x.
- cliffwater.com direct lending indices have reported that loans originated at leverage above 6.0x have experienced materially higher loss rates than the broader direct lending universe, validating the use of leverage caps as a first-order screen.
- Typical senior secured leverage ceiling: 4.5x–5.5x EBITDA
- Minimum underwritten DSCR (base case): 1.15x–1.25x
- First-lien historical mean recovery (S&P): ~65–70%
- FCF conversion floor (institutional standard): >50% pre-amortization
- Revolver utilization trigger for early-warning review: >50% drawn
Common Red Flags Experienced Lenders Flag Immediately
- EBITDA add-backs exceeding 25% of reported EBITDA: a consistent finding in pre-default credits per S&P LCD research.
- Working capital as a source of cash in projections: growth businesses rarely release working capital; this assumption inflates projected free cash flow.
- Covenant packages with >35% headroom to the maintenance test, so-called "covenant lite" structures eliminate the lender’s early-warning system and reduce negotiating leverage before a default.
- Customer concentration above 20% in a single account: loss of that relationship in the downside scenario can trigger an immediate covenant breach.
- Capex described as "discretionary" when it is operationally critical: maintenance capex that is misclassified as growth capex systematically overstates free cash flow.
Underwriting Checklist: Cash Flow Stress Testing
- Obtain 3 years of audited financials plus the most recent interim period; reconcile GAAP EBITDA to adjusted EBITDA line by line.
- Document every add-back with third-party support (invoices, contracts, board minutes); reject any add-back that cannot be independently verified.
- Build an independent revenue model from the bottom up using customer-level data, contract terms, and renewal rates, do not rely on management’s top-line projection.
- Model maintenance capex separately from growth capex using asset depreciation schedules and management’s own maintenance history.
- Run all three scenarios (Base, Downside, Severe Downside) on a monthly cash flow basis to identify the precise month liquidity is exhausted.
- Calculate DSCR, FCF conversion, and liquidity runway in each scenario; document the break-even EBITDA level at which debt service becomes impaired.
- Set covenant thresholds at 15–25% headroom to the downside case, not the base case, so a covenant breach triggers action before the company reaches distress.
- Review revolver availability: confirm borrowing base mechanics, springing conditions, and any blocked-account or dominion provisions.
- Assess customer concentration, supplier concentration, and geographic risk as inputs to the severe downside revenue assumption.
- Document the credit thesis in writing: state what must be true for the base case to hold, what would trigger the downside, and what structural protections exist in each scenario.
Key Takeaways
- The base case is not the underwrite. Institutional credit discipline requires that a loan clears debt service in the downside scenario, not just in management’s projections.
- EBITDA normalization precedes everything. Add-backs above 25% of reported EBITDA are a material red flag and must be stress-tested as if they do not recur.
- DSCR below 1.0x in the severe downside is a structural problem, not a pricing problem. Higher spread does not compensate for fundamental cash flow impairment.
- Covenant headroom should be calibrated to the downside, not the base. A maintenance covenant with 35%+ headroom to the base case provides no protection when it is needed most.
- Liquidity runway is the final arbiter. A company that exhausts its revolver within 6 months of a moderate revenue shock needs structural protections (cash sweeps, blocked accounts, or equity cure rights) baked into the credit agreement before close.


