
The Underwriting Question Every Lender Must Answer
Before a term sheet is signed, every credit underwriter faces a version of the same challenge: how much cash flow deterioration can this borrower absorb before it can no longer service its debt? In a stable economic environment, that question feels theoretical. In 2026, with over $930 billion in commercial loans scheduled to mature this year, triple the volume from the second half of 2025, and all-in interest costs for quality mid-market credits ranging from 9% to 11%, it is the most consequential question in the room. The discipline of cash flow stress testing exists precisely to answer it with rigor, not optimism.
The Analytical Framework: Start with Normalized Free Cash Flow
Stress testing does not begin with a downside scenario. It begins with a defensible base case. Before you can break a cash flow model, you must first build one that accurately reflects the borrower’s true economic output. That means stripping out one-time items, normalizing owner compensation, and separating maintenance capital expenditure from growth CapEx.
The core free cash flow equation used by institutional lenders follows this structure:
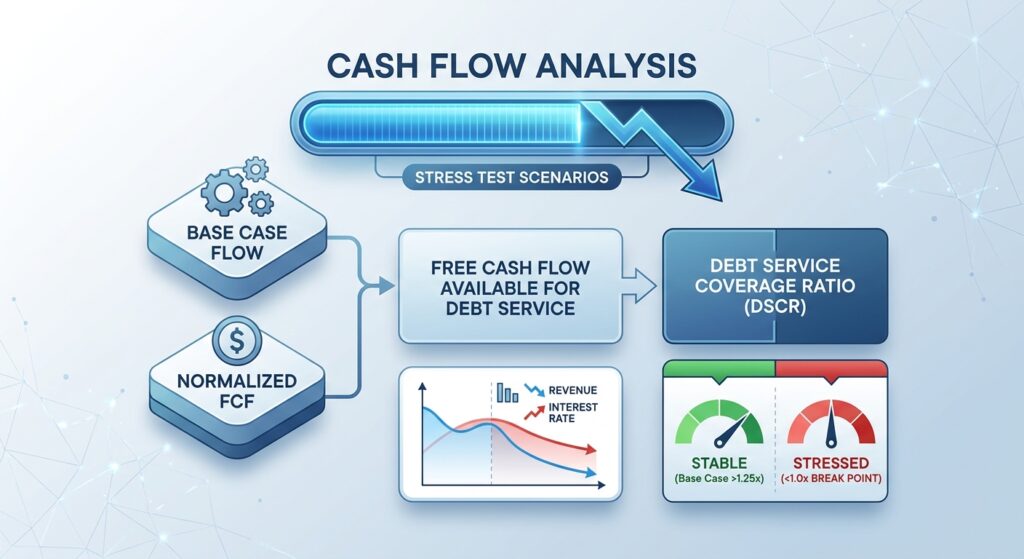
FCF Available for Debt Service = EBITDA − Cash Taxes − Maintenance CapEx − Net Working Capital Change
This figure is then measured against total mandatory debt service, interest expense plus required principal amortization, to produce the Debt Service Coverage Ratio (DSCR). According to Fitch Ratings’ published credit methodology, DSCR is one of the primary quantitative metrics used to assess a rated entity’s cash flow generation relative to its debt service requirements, and it is equally central to unrated middle-market underwriting.
Lenders also examine the Fixed Charge Coverage Ratio (FCCR), which captures all fixed obligations:
FCCR = (EBITDA − CapEx − Taxes) ÷ (Interest + Required Principal Payments)
Most institutional lenders require a minimum FCCR of 1.0x–1.2x at close. A ratio that barely clears 1.0x in the base case is a structural red flag; there is no cushion for any operational underperformance.
Step-by-Step: Stress Testing a $10M EBITDA Manufacturing Company
Consider a hypothetical middle-market manufacturer with $10M in trailing twelve-month EBITDA, $2M in maintenance CapEx, $500K in cash taxes, and flat working capital. At a 5.0x leverage multiple, consistent with current mid-market norms per debt capacity analysis frameworks, total debt is $50M. Assume an all-in interest rate of 9.5%, producing $4.75M in annual interest expense, plus $2M in mandatory term loan amortization.
Base Case:
- FCF Available: $10M − $2M − $0.5M = $7.5M
- Total Debt Service: $4.75M + $2M = $6.75M
- DSCR: 7.5 ÷ 6.75 = 1.11x
A 1.11x DSCR in the base case is thin. Now apply two stress scenarios:
Scenario A, Revenue Compression (15% EBITDA Decline):
- Stressed EBITDA: $8.5M | FCF: $6.0M | DSCR: 0.89x: covenant breach likely
Scenario B, Simultaneous Revenue and Rate Stress (15% EBITDA decline + 100bps rate increase):
- Stressed interest expense: $5.25M | Total debt service: $7.25M | DSCR: 0.83x: default risk is material
This exercise reveals that a borrower with modest base-case coverage can breach financial covenants under a single-variable stress, a scenario far from catastrophic. Cyclical businesses in manufacturing, construction, or distribution routinely see EBITDA fluctuate 20–35% through an economic cycle, which means lenders to this sector must require meaningfully more initial headroom or tighter structural protections.
What Institutional Lenders Look For: Credit Performance Data in Context
Stress testing is calibrated against empirical credit performance. Several data points from institutional frameworks should inform how aggressive or conservative underwriters set their stress assumptions:
- Leverage thresholds: In the current rate environment, total leverage in most mid-market deals ranges from 4.0x to 5.0x EBITDA, down from 6.0x+ in 2018–2019, reflecting lender conservatism in response to higher base rates and tighter coverage math, per ibinterviewquestions.com.
- Distressed credit volume: Total distressed commercial real estate volume reached $126.6 billion in Q3 2025, an 18% year-over-year increase, illustrating how quickly asset-level distress can accumulate when refinancing gaps materialize, per Realty Capital Analytics.
- Recovery rates and deal scale: PGIM’s large-cap private credit analysis finds that larger-scale borrowers (above $75M revenue) historically produce lower default rates and higher recovery rates than smaller credits, a reminder that size and business maturity are genuine credit differentiators, per pgim.com.
- Portfolio-level loss variability: Moody’s Analytics documents that variation in credit quality is substantial across economic cycles and that default risk can increase quickly in correlation with the macro environment, underscoring why single-borrower stress testing must be complemented by portfolio-level concentration analysis.
- Sponsor equity cushion: In higher-rate deal structures, sponsors now contribute 45%–55% of the purchase price in equity, up from 35%–40% in low-rate environments, creating more first-loss protection for lenders but also signaling that purchase price discipline has returned to the market.
- Mid-market leverage range: 4.0x–5.0x Debt/EBITDA
- All-in interest cost, quality mid-market: 9%–11%
- Minimum FCCR (institutional standard): 1.0x–1.2x
- Minimum DSCR (quality credits): 1.25x–2.0x
- Sponsor equity contribution (current): 45%–55%
- Distressed CRE volume, Q3 2025: $126.6B (+18% YoY)
Red Flags to Watch For
- CapEx normalization games: Borrowers who reclassify recurring maintenance spend as growth CapEx to inflate apparent free cash flow. Ask for a multi-year CapEx schedule with line-item explanations.
- Working capital seasonality ignored: Seasonal businesses that peak-EBITDA their TTM financials without adjusting for trough working capital cycles will overstate coverage ratios by 15–30%.
- Single-scenario stress testing: Underwriters who model only a revenue decline but not a margin compression, rate increase, or working capital squeeze are stress testing in name only.
- Customer concentration masking volatility: A borrower with 40%+ revenue from one customer may show stable historical results, until they don’t. Lenders should haircut EBITDA in the stress case by the full loss of that customer relationship.
- EBITDA add-back stacking: When adjusted EBITDA exceeds reported EBITDA by more than 15–20%, the normalization assumptions require independent scrutiny, not acceptance.
Underwriting Checklist: Cash Flow Stress Testing Diligence
- ✅ Obtain three years of audited financials plus LTM management accounts
- ✅ Reconstruct EBITDA from scratch, do not start from management’s adjusted figure
- ✅ Separate maintenance CapEx from growth CapEx using asset register and CFO interview
- ✅ Map seasonal working capital patterns across 12 months of monthly bank statements
- ✅ Build base case, downside (−15% EBITDA), and severe downside (−25–30% EBITDA) models
- ✅ Apply rate stress of +100–200bps to floating rate debt service in each scenario
- ✅ Calculate DSCR, FCCR, and Interest Coverage at every scenario level
- ✅ Identify the EBITDA level at which first covenant breach occurs (covenant headroom analysis)
- ✅ Assess customer and supplier concentration risk with revenue haircut scenarios
- ✅ Confirm that the base-case DSCR provides minimum 20–25% cushion above covenant trigger
Key Takeaways
- Base case integrity is the foundation: Stress tests are only as reliable as the normalized cash flow they start from. EBITDA reconstruction is non-negotiable.
- Thin coverage ratios are structural problems: A base-case DSCR below 1.20x leaves insufficient room for any underperformance and should require deal restructuring, not optimistic projections.
- Multi-variable stress testing is the standard: Revenue, margin, rate, and working capital stresses must be modeled in combination, isolated scenarios understate true downside exposure.
- Capital intensity is a leverage limiter: Businesses with CapEx exceeding 8–10% of revenue have materially less free cash flow available for debt service, and leverage sizing must reflect this reality.
- Portfolio context matters: Individual loan stress testing must be layered with portfolio-level concentration analysis to avoid correlated losses across a lender’s book during a downturn.


