
The Underwriting Question Every Lender Must Answer Before Closing
Imagine you are six months into underwriting a $50 million senior secured term loan to a specialty manufacturer. The sponsor projects $10 million in EBITDA, total leverage sits at 5.0x, and the business has a decade of operating history. The deal looks clean on paper. Then the question every disciplined lender must ask arrives: What happens when it doesn’t go according to plan?
Cash flow stress testing is the analytical discipline that separates sound underwriting from optimistic deal-making. It forces lenders to pressure-test the borrower’s ability to service debt not under management’s base case, but under the cyclical, operational, or macro conditions that historically materialize with uncomfortable regularity. According to Oak Hill Advisors’ February 2026 Credit Investor’s Checklist, credit managers that re-underwrite their portfolios continuously and challenge prior assumptions are better positioned to identify risks earlier, and generate more durable risk-adjusted returns across full credit cycles.
This guide teaches that discipline, step by step.
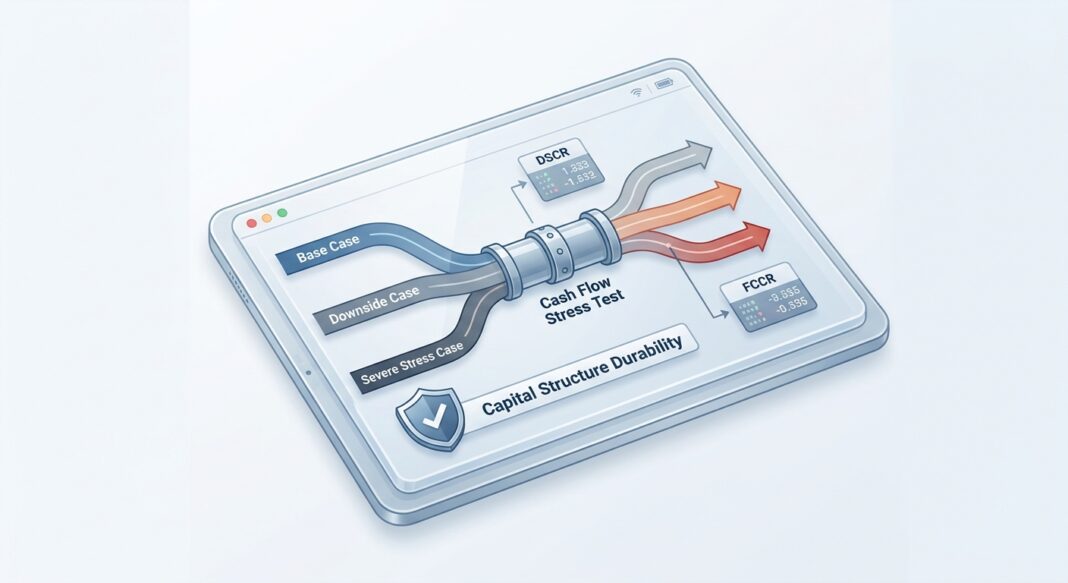
The Analytical Framework: Three Scenarios, One Capital Structure
Effective cash flow stress testing is built on scenario architecture. Rather than a single projection, experienced lenders construct at least three distinct cases, each with its own revenue assumptions, margin profile, capital expenditure load, and working capital behavior.
- Base Case: Management’s operating plan, adjusted for any EBITDA normalizations identified during diligence. This is not the lender’s underwriting case; it is the ceiling, not the floor.
- Downside Case: A plausible recession or sector-specific shock. Typically models a 15–25% EBITDA contraction driven by volume decline, pricing pressure, or margin compression from input cost inflation.
- Severe Stress Case: A tail scenario that tests covenant triggers and liquidity runway. This may model a 35–50% EBITDA decline (consistent with cyclical troughs in manufacturing, industrial, and consumer-facing sectors) alongside a working capital drag and a capex deferral.
The fundamental cash flow identity that governs all three cases is straightforward:
FCF Available for Debt Service = EBITDA − Cash Taxes − Maintenance CapEx − ΔWorking Capital
This free cash flow figure must then be measured against mandatory debt service obligations, interest expense plus required principal amortization, to determine whether the borrower can remain current across each scenario. The debt capacity framework widely used in leveraged finance confirms that cash flow, not asset value, is the binding constraint for most LBO-style credit structures.
Worked Example: $10M EBITDA Specialty Manufacturer
Consider a specialty manufacturer with:
- LTM EBITDA: $10.0M (post-normalization)
- Total Debt: $50.0M (5.0x leverage)
- All-in Interest Rate: 9.5% (reflecting current mid-market pricing)
- Annual Interest Expense: ~$4.75M
- Mandatory Amortization (TLB 1%): $500K
- Maintenance CapEx: $1.5M
- Cash Taxes (effective 25%): ~$1.2M (post-interest shield)
In the Base Case, FCF available for debt service is approximately $6.55M, against total debt service of $5.25M. The Debt Service Coverage Ratio (DSCR) registers at 1.25x, thin, but serviceable. The Fixed Charge Coverage Ratio (FCCR), calculated as (EBITDA − CapEx − Taxes) ÷ (Interest + Amortization), comes in at approximately 1.19x.
Walking Through the Downside: Where Structures Break
Now apply a 25% EBITDA stress. EBITDA drops from $10.0M to $7.5M. Interest expense remains fixed at $4.75M. Maintenance CapEx is unchanged. Working capital absorbs an additional $300K as receivables collections slow. Cash taxes decline modestly.
Revised FCF available for debt service: approximately $4.1M. Against $5.25M in required payments, the DSCR falls to 0.78x: a covenant breach under nearly any standard maintenance covenant structure, and a signal that the borrower cannot cover fixed charges from operations alone.
This is precisely where lender protections matter. As the OHA Credit Investor’s Checklist emphasizes, structuring expertise at origination (including tight EBITDA definitions, meaningful covenant headroom analysis, and protections against liability management exercises (LMEs)) is a primary driver of long-term credit performance. A lender who negotiates a 1.10x FCCR maintenance covenant with 20% headroom in the base case will hit the trigger at a 17% EBITDA decline. That early warning mechanism is the architecture of downside protection.
In the Severe Stress Case (40% EBITDA decline to $6.0M), coverage collapses entirely without covenant relief, and liquidity runway becomes the critical question: How many months of revolver capacity does the borrower have before a payment default? At this point, the lender’s workout and restructuring expertise becomes the differentiating factor in recovery outcomes.
OHA’s analysis illustrates this with clarity: two portfolios with identical spreads and default rates but differing recovery rates produce materially different realized returns, the higher-recovery portfolio generates 44% more loss-adjusted spread. Recovery is not an accident; it is an underwriting outcome engineered at origination.
What Institutional Lenders Require: Benchmarks and Red Flags
Institutional credit standards, as documented by rating agencies and leading direct lenders, provide the benchmarks against which any stress test should be calibrated.
📊 Credit Performance Data Box
- 4.0x–5.0x Debt/EBITDA: Current market range for traditional LBO structures, down from 6.0x+ pre-2022, reflecting higher all-in interest costs of 9%–11% for quality mid-market credits. Source: Debt Capacity Analysis in LBOs
- 32% lower default rate: Borrowers with ≥$100M EBITDA demonstrated a 32% lower default rate versus smaller borrowers across multiple credit cycles (1995–2025). Source: OHA / PitchBook LCD, Q4 2025
- 1.25x minimum DSCR: Widely required by institutional lenders in current market conditions; 2.0x or higher preferred for quality credits. Source: Leveraged Finance market practice
- 1.0x–1.2x minimum FCCR: Standard maintenance covenant floor, capturing total debt service including mandatory amortization. Source: Fitch Ratings Procedures and Methodologies
- 45%–55% equity contribution: Current sponsor equity requirements in leveraged buyouts, up from 35%–40% in the lower-rate environment, reflecting tighter credit conditions. Source: Debt Capacity Analysis in LBOs
Red Flags That Stress Tests Routinely Surface
- CapEx as a percentage of revenue exceeding 10%: Signals capital intensity that materially compresses FCF available for debt service. Heavy manufacturing, infrastructure, and specialty industrial borrowers require adjusted interest coverage analysis. ibinterviewquestions.com
- Single-customer revenue concentration above 30%: A concentration event can impair the entire debt structure. Lenders should model the loss of that relationship explicitly in the downside case.
- Loose EBITDA definitions: Aggressive add-backs (cost savings, synergies, one-time items) that inflate reported EBITDA create covenant headroom illusions. Fitch’s rating methodology, documented in its Procedures and Methodologies, explicitly focuses on cash flow generation relative to debt service, not reported EBITDA.
- Cyclical sector exposure without cycle-adjusted underwriting: Automotive, construction, and commodity-linked borrowers can see EBITDA fall 30%–50% in recessions. Stress tests must reflect sector-specific trough conditions, not generic haircuts.
- Working capital seasonality without a revolver: Businesses with seasonal cash conversion cycles that lack adequate revolving credit capacity face acute liquidity risk during trough periods, even when annual DSCR appears adequate.
Cash Flow Stress Testing Underwriting Checklist
Before committing capital, a disciplined lender should work through the following diligence sequence:
- Normalize LTM EBITDA: Strip out non-recurring items, aggressive management add-backs, and pro forma synergies not yet realized. Build the underwriting EBITDA from audited financials, not the CIM.
- Separate maintenance from growth CapEx: Confirm what the business must spend to maintain current operations versus what is discretionary. Stress cases should assume growth CapEx is deferred; maintenance CapEx is not.
- Model working capital behavior under stress: Request three years of monthly cash flow data. Identify seasonal patterns, DSO trends, and DPO dynamics. Quantify the working capital drag in a revenue contraction scenario.
- Calculate DSCR and FCCR across all three scenarios: Document the EBITDA decline at which each metric breaches its covenant floor. That break-even point is your headline risk metric.
- Stress interest expense for rate sensitivity: For floating-rate obligations, model a 200–300 basis point rate increase against the downside EBITDA case simultaneously. Confirm the structure remains viable.
- Map liquidity runway in the severe case: Calculate months of available revolver capacity assuming cash flows go negative. Determine at what point the borrower requires a waiver, amendment, or new capital.
- Validate covenant headroom: Confirm that the maintenance covenant trigger level provides a meaningful early warning, typically set 20–25% above the downside break-even level, without being so tight it creates an automatic technical default on minor underperformance.
- Document recovery analysis: Assess collateral coverage and recovery value under a liquidation scenario. A lender’s realized return is the product of probability of default and loss given default, OHA’s framework demonstrates that recovery rate differentiation is where credit alpha is generated or destroyed.
Key Takeaways for Credit Practitioners
- ✓ The base case is not the underwriting case. Institutional lenders build their credit thesis on the downside scenario, not management’s projection. Covenant structures, pricing, and sizing decisions should all be anchored to what the business can support under stress, not at the peak.
- ✓ DSCR and FCCR are lagging indicators without scenario architecture. A single-point coverage ratio calculation is insufficient. Lenders must identify the EBITDA level at which each covenant breaches, and assess the likelihood of reaching that level given sector cyclicality and business model fragility.
- ✓ Recovery is engineered at origination, not negotiated in restructuring. Tight EBITDA definitions, collateral perfection, anti-LME protections, and meaningful covenant packages all determine recovery outcomes before a deal closes. Structural sloppiness at underwriting becomes a workout problem later.
- ✓ Borrower size materially affects default probability. Larger borrowers with greater than $100M EBITDA have demonstrated a 32% lower default rate than smaller borrowers across three decades of credit cycles. Scale provides operational flexibility, pricing power, and access to capital markets that smaller companies lack.
- ✓ Continuous re-underwriting is a risk management obligation, not a portfolio management courtesy. Credit performance evolves. A borrower that passes every diligence test at origination can deteriorate materially within 18 months. Lenders who monitor covenant headroom, liquidity trends, and industry conditions on an ongoing basis identify risk earlier, and preserve more capital when cycles turn.


