
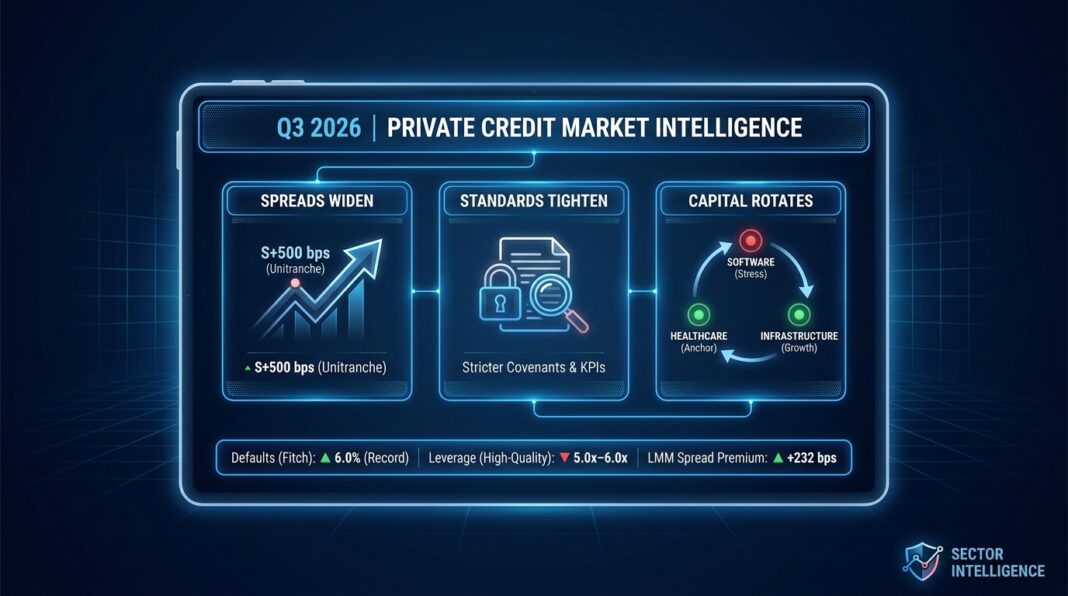
The Lender-Friendly Reset Is Real, and Accelerating
Private credit entered 2026 riding two years of momentum, but three simultaneous shocks have fundamentally repriced risk and redistributed lender appetite across the market. Capstone Partners’ Q1 2026 Middle Market Leveraged Finance Report documents that a coordinated U.S.-Iran military operation in late February 2026, an accelerating AI-driven reassessment of software credit quality, and a wave of BDC redemption requests together caused a 22.5% year-over-year decline in overall institutional leveraged loan value in Q1 2026. The result is a market that, as of mid-September 2026, is best characterised not by systemic collapse, but by purposeful, structural repricing.
The Federal Reserve’s July 2026 Senior Loan Officer Opinion Survey (SLOOS) confirms that bank C&I lending standards are now essentially unchanged after a period of tightening in Q1, while C&I demand from large businesses is firming. But the headline stabilisation masks a more nuanced picture: banks tightened standards across all Non-Depository Financial Institution (NDFI) loan categories through Q2, imposing stricter covenants, higher risk premiums, and lower maximum credit line sizes directly on private credit fund counterparties.
For institutional investors and business operators, the signal is unambiguous: the era of borrower-friendly terms is receding. Capital is becoming more selective, covenants are returning, and the dispersion between sector winners and losers is the defining theme of H2 2026. Managers and borrowers who understand where the reset is deepest (and where it has not yet arrived) hold the informational edge.
Quantitative Market Snapshot: Public & Private Rates, Spreads, and KPI Benchmarks
The table below reflects current pricing across public and private credit markets as of Q2–Q3 2026, drawn from institutional research sources. These metrics form the basis for lender underwriting expectations and borrower cost-of-capital modelling.
| Metric | Current Value (Q2–Q3 2026) | Prior Period | Direction | Source |
|---|---|---|---|---|
| Middle Market Unitranche Spread (New Issue) | S+500 bps | S+450–475 bps (mid-2025) | ▲ Wider | Hamilton Lane, 2026 |
| All-In Unitranche Coupon (New Issue) | ~9.5%–10.5% | ~12.5% peak (mid-2023) | ▼ Lower | CTA Acquisitions / PitchBook LCD, July 2026 |
| 3-Month Term SOFR | ~3.68% | ~3.67% (Q1 2026) | → Flat | VRC, Q2 2026 Private Markets Report |
| 5-Year U.S. Treasury Yield | ~4.23% | 3.92% (Q1 2026) | ▲ Higher | VRC, Q2 2026 Private Markets Report |
| Leverage Multiple (High-Quality Deals) | 5.0x–6.0x Debt/EBITDA | 5.5x–6.5x (2021–22 vintages) | ▼ Tighter | VRC, Q2 2026 Private Markets Report |
| Private Credit Default Rate (Proskauer, Q2 2026) | 2.51% (senior secured / unitranche) | ~1.5%–2.5% (2010–2022 avg.) | ▲ Elevated | Investing.com / Proskauer Default Index, Aug 2026 |
| Fitch Fully-Loaded Private Credit Default Rate | 6.0% (April 2026, record high) | ~5.0% (2025 est., BofA) | ▲ Record | Forbes / Fitch Ratings, May 2026 |
| Lower Middle Market Spread Premium Over Large-Cap | +232 bps | Narrower (2024) | ▲ Widened | Avante Capital Partners, Feb 2026 |
Key Structural Reference Points
- SOFR is range-bound: Three-month Term SOFR increased just one basis point quarter-over-quarter to 3.68% in Q2 2026, per VRC’s Q2 2026 Private Markets Update. Market forward curves reflect a higher-for-longer rate environment, complicating refinancing economics for floating-rate borrowers.
- Spread rebound from the mid-400s: Hamilton Lane notes private credit spreads have reset from the mid-400 bps level back to the S+500 context, driven by geopolitical risk, AI-related credit reassessment, and BDC redemption pressure, and are now yield-enhancing for disciplined deployers.
- 2021–22 vintage stress is measurable: VRC’s proprietary cohort data shows that leverage on 2021–22 vintage loans has increased approximately 0.9x turns since origination, while adjusted cash interest coverage has declined roughly 0.4x: a direct consequence of rate-shocked debt service on structures underwritten at historically low base rates.
- The illiquidity premium persists: Historically, private credit yields have run roughly 166 bps above comparable public loans as compensation for illiquidity and the absence of market-based pricing. With public high yield spreads remaining near multi-decade tights, that premium remains structurally intact, per Investing.com’s 2026 private credit analysis.
Sector Analysis: Where Lenders Are Leaning In, and Pulling Back
🔴 Software & Technology: The Epicentre of Stress
Software is the most consequential fault line in 2026 private credit. According to S&P Global data cited by Prime Buchholz, software and technology companies accounted for roughly 25% of the private credit market through year-end 2025: making AI-driven disruption risk a systemic, not idiosyncratic, concern. Secondary spreads for software credits are now approximately 245 bps wider than year-end levels and ~229 bps above the broader B-rated loan index, per PitchBook LCD data as of June 19, 2026. Approximately $17 billion in U.S. software buyouts were closed or announced in the first five months of 2026, only 17% of the 2022 peak, per Goldman Sachs / PitchBook. Many lenders remain risk-off or already overexposed, limiting incremental deployment. Outstanding SaaS loans had grown from $8 billion in 2015 to over $500 billion (19% of total direct loans) by end-2025, per the BIS Quarterly Review (March 2026).
🟢 Healthcare: The Anchor Sector, With Divergent Signals
Healthcare has become the single largest sector for U.S. direct lending, accounting for roughly 22% of all direct lending issuance YTD through March 2026, up from 18% in 2025, per RSM’s April 2026 Healthcare Industry Trend Watch. Demographic tailwinds and non-cyclical cash flows continue to attract lenders seeking stable income. Healthcare was also the only major sector that did not see significant year-over-year spread tightening in 2025, with spreads holding at approximately SOFR+500 bps in Q4 2025, per Octus Data. However, Morgan Stanley’s direct lending team maintains a significant underweight to healthcare, noting it has led all sectors in loans placed on non-accrual status over the past year, a divergence that underscores the importance of sub-sector selection within a broadly favoured vertical.
🟢 Infrastructure, Energy & Digital: The Secular Growth Allocation
Private credit is increasingly displacing traditional bank lending in large-scale infrastructure. Priority sectors for the largest managers heading into H2 2026 include energy infrastructure, digital infrastructure (data centres), defence, and next-generation manufacturing, all requiring patient, long-duration institutional capital. Morgan Stanley estimates private credit could supply more than half of the $1.5 trillion needed for global data centre buildouts through 2028, per Creative Planning’s analysis (March 2026). In infrastructure broadly, private credit is being used to fund large-scale renewable energy developments and AI-driven power grid investments where bank capital is insufficient or too short-tenured, per Chambers & Partners’ 2026 Private Credit Guide.
🟡 Lower Middle Market ($5M–$50M EBITDA): A Structural Bright Spot
The spread premium story is clearest in the lower middle market, where the wave of large-cap capital compression has not arrived. Avante Capital Partners documents that the lower middle market’s spread premium over large-cap widened to 232 bps, providing a yield buffer that is both structural and durable. PitchBook’s July 2026 analysis confirms that activity at the smaller end has been more resilient than the upper middle market, driven by non-LBO transactions including repricings and extensions, and that Crescent Capital raised $10.8 billion for its largest lower middle market direct lending vehicle in June 2026, validating institutional conviction in the segment.
🔴 Energy-Intensive Industrials & Manufacturing: Tighter Underwriting
Capstone Partners’ Q1 2026 Leveraged Finance Report confirms that lenders have tightened underwriting standards for energy-intensive industries following geopolitical disruptions and elevated oil and transportation costs. Businesses whose leverage was predicated on stable energy costs face wider spreads and stricter covenant packages, and oil price sensitivity will remain a key deal-structuring variable through year-end.
Underwriting Standards & Financial KPI Thresholds: What Lenders Are Demanding
The most operationally significant shift in 2026 is not the spread move; it is the reassertion of lender discipline in financial KPI underwriting. Lord Abbett’s 2026 Midyear Outlook documents that spreads have widened roughly 50–100 bps since late 2025 while defensive terms have simultaneously improved: more covenants, tighter documentation, reduced PIK tolerance.
FCCR: Lenders are now underwriting to a forward-looking Fixed Charge Coverage Ratio (FCCR) that incorporates stressed interest rate expectations, constraining available leverage multiples. A stressed FCCR scenario (adding 100 bps to floating rate debt and reclassifying 25% of projected capex as maintenance) yielding a ratio below 1.1x is increasingly viewed as insufficient early-warning protection. For operators, this means EBITDA-based leverage availability is now gated not just by enterprise value, but by a dynamic, rate-sensitive coverage floor.
Leverage: For high-quality transactions, competitive dynamics have supported 5.0x–6.0x Debt/EBITDA through June 2026, but underwriting has become materially more conservative since March, per VRC. For 2021–22 vintage credits, VRC’s cohort data shows leverage has crept up ~0.9x while interest coverage has declined ~0.4x, indicating those capital structures are increasingly at odds with current underwriting thresholds. Heron Finance’s Q2 2026 Benchmark Report notes that loan-to-value (LTV) ratios have remained conservative and stable across segments, confirming that the 2021–22 vintage erosion is a coverage and cash-flow problem, not a collateral implosion.
Covenant Structure: Lord Abbett confirms that new loans are increasingly structured with more covenants, less leverage, fewer PIK requests, and tighter documentation, a direct reversal of the 2021–2024 borrower-friendly era. The Fed’s April 2026 SLOOS noted that banks applied stricter loan covenants, higher risk premiums, and shorter maximum maturities to NDFI counterparties, tightening the upstream financing costs of private credit funds themselves.
PIK as a Stress Signal: Rising Payment-in-Kind (PIK) income as a share of total fund returns is emerging as the clearest early warning indicator of hidden credit deterioration. The Cliffwater Direct Lending Index estimated realised losses at 0.70% for 2025, below the 1.01% historical average, but this figure excludes PIK income that may never convert to cash. Institutional investors should specifically interrogate the PIK-to-cash-pay income ratio across portfolio positions.
Implications: What This Means for Institutional Investors and Operators
For Institutional Investors (LPs, Allocators, Asset Managers)
- The deployment gap is a structural opportunity signal. Per Preqin data, direct lending funds raised $16.25 billion in Q2 2026, the strongest fundraising quarter in two years, while actual loan origination fell ~55% quarter-on-quarter to $33.6 billion. Deal count dropped to 154 in Q2, from 217 in Q1, the weakest since Q2 2023. GPs with dry powder and deal selectivity are entering H2 2026 with an informational advantage.
- Default rate interpretation requires definitional discipline. Proskauer’s Q2 2026 Private Credit Default Index reports 2.51% across 716 loans; Fitch’s broader measure reached a record 6.0% in April 2026. Per Investing.com, distressed restructurings (debt exchanges and maturity extensions agreed under pressure) account for roughly 65% of all private credit defaults. Allocators must standardise their definition and demand portfolio-level disclosure of LME activity and PIK share.
- Sector rotation is the alpha source, not asset class beta. Lord Abbett’s midyear outlook concludes that the opportunity in H2 2026 will go to managers focused on where they are lending, how loans are structured, and whether portfolios carry the right balance of income and downside mitigation, not to those relying on broad asset-class tailwinds.
- The lower middle market offers structural yield protection. With a 232 bps spread premium over large-cap and real maintenance covenants, versus the cov-lite structures prevalent in the upper market, the $5M–$50M EBITDA segment provides both higher absolute yield and earlier credit cycle detection, per Avante Capital.
For Business Operators and Borrowers
- Cost-of-capital models must be updated. Operators still modelling project hurdle rates against bank financing baselines are working from an outdated framework. Private credit premiums of 100–300 bps above bank rates are not cyclical, they are structural, reflecting the permanent shift in corporate lending market architecture since Basel III.
- FCCR and DSCR thresholds will determine capital availability. The forward-looking FCCR stress test (incorporating rate sensitivity and maintenance capex reclassification) is the new gating metric. Borrowers with EBITDA-to-interest coverage ratios approaching 1.5x or below face meaningfully tighter pricing and availability, particularly in volatile EBITDA sectors. VRC’s data shows that average interest coverage for early 2022 vintages had declined to the mid-1.5x range by Q3 2024, now a key refinancing risk trigger.
- Software-adjacent businesses must address AI disruption proactively. Capstone Partners confirms that an AI strategy assessment and AI disruption risk evaluation have emerged as critical analytical components in underwriting new transactions. Borrowers who cannot articulate a defensible AI positioning will face wider spreads, lower leverage availability, and heightened lender scrutiny, regardless of historical performance.
Forward-Looking View: Liquidity and Lending Dynamics Over the Next 3–6 Months
Lord Abbett’s midyear view characterises H2 2026 as being defined by dispersion: the credit cycle is not turning down uniformly; it is bifurcating sharply between high-quality, covenant-protected credits and the legacy of 2021–22 vintage excess. Morgan Stanley Investment Management expects a growing refinancing wave to gradually overtake private credit supply through H2 2026 and into 2027, creating an imbalance that should allow disciplined lenders to preserve terms and capture illiquidity premiums.
The regulatory calendar adds pressure. The re-proposed Basel III Endgame rule, currently in comment period and unlikely to bind before 2027, could modestly bring large U.S. banks back into middle-market lending, adding competitive pressure to private credit spreads in the upper market. Simultaneously, a proposed NAIC clarification on how life insurers should risk-weight private structured credit could raise required capital charges on CLO and structured-credit positions in general accounts, slowing insurance-funded private credit if adopted in 2026.
On the macro side, VRC confirms that the forward rate curve is broadly flat as of June 2026, with market expectations reflecting a higher-for-longer environment. For floating-rate borrowers, every quarter without a Fed cut compounds the cash-flow stress on marginal credits. Guggenheim’s Q2 2026 Credit Outlook notes that floating-rate borrowers continue to face higher stress than fixed-rate issuers, with payment defaults and LMEs running roughly equal over the past twelve months, a dynamic unlikely to reverse without meaningful rate relief.
The constructive case rests on deal flow recovery. Hamilton Lane estimates a $1.7 trillion financing need over the next four years when combining the PE-to-credit dry powder gap with upcoming loan maturities, providing ample deployment runway for patient capital. Morgan Stanley expects M&A to broaden through 2026, creating more exit and financing opportunities for mid-sized private companies, and believes the current cycle will last longer than is generally appreciated.
Key Market Insights
- ⚡ Spreads have reset from mid-400s to S+500 bps on new-issue middle market unitranche loans, the lender-friendly reset is measurable, not narrative. Yield-enhancing for disciplined deployers; a cost-of-capital shock for borrowers refinancing 2021–22 vintage debt. (Hamilton Lane)
- ⚡ Default rate divergence is definitional and material. Headline outright default rates (~2.5%, Proskauer) dramatically understate credit stress when LMEs and distressed exchanges are included (~6.0%, Fitch). Investors must demand portfolio-level disclosure of PIK share and LME activity to assess true impairment exposure. (Forbes / Fitch)
- ⚡ Software is a distressed sector, not a cyclical dip. At 25% of private credit market exposure and 245 bps wider secondary spreads vs. year-end, AI-driven disruption risk is structural. Lenders are limiting incremental software exposure; borrowers must proactively demonstrate AI competitive positioning to access capital at market rates. (VRC / PitchBook LCD)
- ⚡ The lower middle market offers the best risk-adjusted entry point in the cycle. A 232 bps spread premium over large-cap, real maintenance covenants, lower software exposure, and resilient deal flow from boomer succession create a structurally differentiated opportunity that the large-cap capital wave has not yet compressed. (PitchBook, July 2026)
- ⚡ FCCR is the new leverage gating metric. Lenders are stress-testing fixed charge coverage ratios under rate-shocked assumptions, a forward-looking underwriting standard that constrains available leverage for any borrower below 1.1x on a stressed basis. Operators who cannot demonstrate FCCR resilience under a +100 bps scenario will face both pricing penalties and reduced maximum loan sizes in H2 2026 and beyond. (VRC Q2 2026)


