
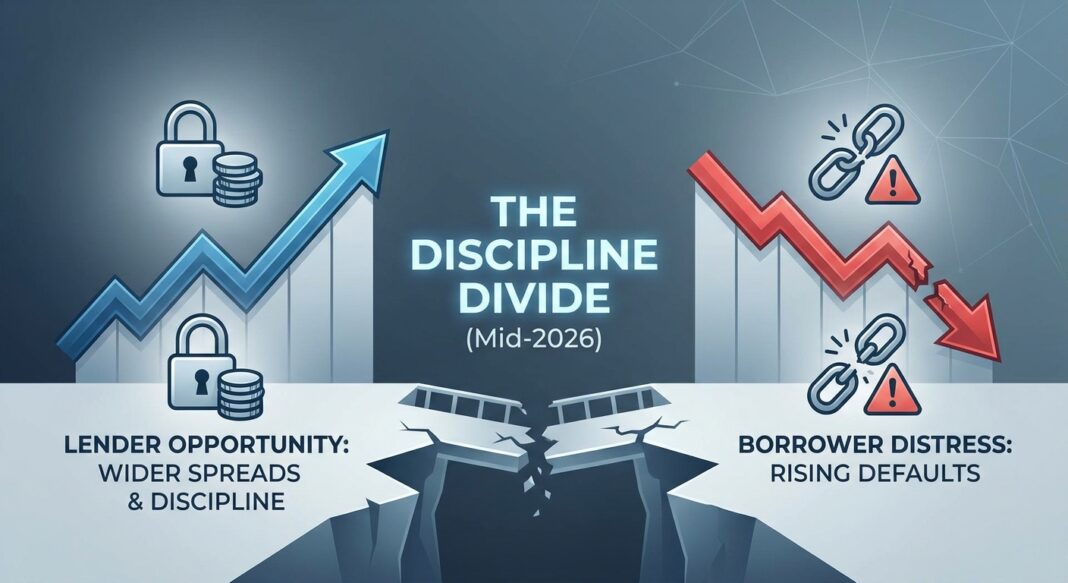
Market Headline: The Lender-Friendly Reset Is Real, But Unevenly Distributed
The private credit market has entered a structurally distinct phase in mid-2026, one that is simultaneously generating record fundraising and record stress. The headline tension: capital is pouring in at a historic clip even as the borrowers underpinning that capital are showing increasing signs of distress. Three converging forces drove this inflection: the outbreak of the U.S.–Iran military conflict in late February 2026 and its macro ripple effects on energy costs and inflation; an accelerating AI-driven reassessment of the software sector’s credit quality; and a wave of BDC and private credit redemption requests that exposed structural vulnerabilities in retail-oriented private credit vehicles.
The result is a market in bifurcation. At the macro level, spreads in the middle market have widened 50–100 basis points since late 2025, covenant and documentation quality is improving, and managers with dry powder are reasserting selectivity. At the micro level, Fitch Ratings has recorded a private credit default rate of 6.1% on a trailing-twelve-month basis through July 2026: a record high, while PIK (payment-in-kind) usage has risen from roughly 6% of BDC loans in early 2022 to approximately 10% today, signaling broad-based cash flow pressure across the middle market. For institutional investors and operators alike, the strategic read is clear: 2026 is a year defined by dispersion, not direction.
Meanwhile, bank lending standards have stabilized. The Federal Reserve’s July 2026 SLOOS confirmed that C&I lending standards held broadly unchanged in Q2, with stronger demand from large and middle-market firms, but markedly weaker demand from small businesses, a divergence that reinforces the structural advantage private credit retains in the sub-$50M EBITDA segment. The regulatory environment, however, is tightening with it, as the SEC, FSB, and Treasury Department sharpen focus on valuation practices, redemption gating, and retail investor disclosures across the BDC complex.
Quantitative Market Snapshot
The table below captures the six most operationally significant market metrics as of August 28, 2026, with prior-period comparisons and source attribution. These figures represent the clearest signal set available for credit cycle positioning.
| Metric | Current Value | Prior Period | Trend | Source |
|---|---|---|---|---|
| Middle Market Private Credit Spreads (SOFR+) | ~S+500 bps | S+440–460 bps (mid-2025) | ▲ +50–100 bps since late 2025 | Hamilton Lane / PitchBook |
| High-Yield Bond Spreads (OAS) | ~250–270 bps | ~316 bps (early 2026 peak) | ▼ Compressed sharply | Bankers Edge Advisory, Aug 2026 |
| Investment-Grade Corporate Spreads | ~70 bps | ~85–90 bps (Q1 2026) | ▼ Tighter | Chicago Atlantic, Q2 2026 |
| Fitch Private Credit Default Rate (TTM) | 6.1% (July 2026) | 6.0% (June 2026) / ~3.5% (2025 avg) | ▲ Record high | Angel Investors Network / Fitch, Aug 2026 |
| BDC Non-Accrual Rate (Top 20, at cost) | 2.8% (Q2 2026) | 2.0% (Q1 2026) / ~1.4% (YE 2023) | ▲ Highest since 2017 | PitchBook LCD / Solve / Fitch, Aug 2026 |
| Direct Lending Loan Origination (Q2 2026) | $33.6B | $74.7B (Q1 2026) | ▼ -55% QoQ; weakest since Q2 2023 | PitchBook LCD / Angel Investors Network |
| PIK Usage (BDC Loan Portfolios) | ~10% of BDC loans; 8% of BDC income | ~6% (early 2022) | ▲ +67% over 3 years | Federal Reserve Bank of Boston, Aug 2026 |
All data as of August 2026 or most recent available. Sources linked above. For informational purposes only.
Rate Context: The SOFR and Treasury Floor
Three-month Term SOFR stood at approximately 3.68–3.69% as of June 2026, having increased just one basis point quarter-over-quarter, while five-year U.S. Treasury yields climbed to approximately 4.23% in June, up from 3.92% in March, reflecting a market that has broadly repriced toward a higher-for-longer rate environment. Forward curves as of mid-year 2026 remain flat, removing the tailwind of rate-cut optionality that had buffered borrower FCCR expectations in late 2024 and early 2025. For borrowers carrying floating-rate senior debt in the S+450–500 range, all-in coupons remain in the 8.1–8.7% range, meaningfully compressing fixed charge coverage ratios for credits without commensurate EBITDA growth.
Sector Analysis: Where Capital Is Flowing, and Where It Is Retreating
■ Healthcare: The Double-Edged Sector
Healthcare has emerged as the single largest sector for U.S. direct lending, accounting for roughly 22% of all direct lending issuance year-to-date through March 2026, up from 18% in 2025, driven by its defensive demand characteristics and predictable cash flows. Private credit has increasingly filled financing gaps for hospitals, physician platforms, behavioral health providers, and post-acute operators. However, that concentration is now a growing liability. Healthcare has led all sectors in loans placed on non-accrual status over the past year, and several large managers, including Morgan Stanley Investment Management, have reported maintaining a significant underweight to the sector precisely because of this dynamic. As recovery rates fall and underwriting assumptions are tested on 2020–2022 vintage deals, lenders are intensifying focus on provider fundamentals: cash-flow stability, payer mix, labor costs, and governance quality.
■ Software/Technology: Stress Is Sector-Specific, Not Systemic
The most acute credit stress in 2026 is concentrated in enterprise software. Secondary spreads for software credits are approximately 245 basis points wider than year-end levels and roughly 229 basis points above the broader B-rated loan index, reflecting ongoing uncertainty from AI-driven disruption of legacy software business models. A large cohort of enterprise software transactions was financed between 2019 and 2022, when rates were low and AI risk was not yet a central underwriting concern; many of these companies were not yet generating meaningful free cash flow at origination. The 2026 cluster of PIK conversions and restructurings is notably concentrated in healthcare and software, where higher-for-longer rates met business models underwritten on cheaper money. Nearly 30% of private credit-focused BDC portfolios carry software sector exposure, making this the most operationally critical underwriting variable heading into H2 2026.
■ Industrials, Business Services, and Aerospace & Defense: Active and Attracting Capital
Business services and industrials mid-market buy-and-build strategies remain active, with PE activity dominated by mid-market platforms. Aerospace and defense is seeing strong M&A-driven credit demand, supported by government spending tailwinds. Lenders in these sectors report strong appetite, particularly for assets with long-term contracted revenue, favorable pricing power, and limited AI disruption exposure. Infrastructure-related assets (particularly data centers, power generation, and industrial logistics) are attracting hybrid financing structures blending senior debt and preferred equity, with Morgan Stanley and Apollo among those citing significant origination opportunity.
■ Consumer and Retail: Caution Flags
The PwC Global Private Credit Survey 2026 found that managers expect stress to be most acute over the next one to two years in consumer and retail (56% of respondents), automotive (42%), hospitality and leisure (27%), and technology (24%). Consumer businesses exposed to lower-income customers face a compound headwind: margin compression, higher financing costs, and softening demand. Lenders are tightening underwriting standards for energy-intensive industries and businesses whose leverage was predicated on stable energy costs, a dynamic triggered directly by the geopolitical disruption in Q1 2026.
■ Real Estate (CRE): Tentative Green Shoots
The July 2026 SLOOS showed that banks eased CRE lending standards by the most since early 2022, a sign that some appetite for risk is returning to the institutional banking channel. More banks also reported firmer demand for CRE loans. Industrial and apartment assets are cited as the strongest sub-sectors, while residential real estate remains constrained by elevated mortgage rates and high home prices. This CRE easing creates a potential convergence dynamic with private credit: as bank appetite returns selectively, private lenders face increased competition in core CRE deals but retain a structural edge in transitional, value-add, and specialty property types.
Regulatory Forces and Structural Shifts
The regulatory backdrop has shifted materially in 2026. The SEC’s 2026 examination priorities explicitly flag private credit and private funds with extended investment lock-ups, with focused scrutiny on the adequacy of risk disclosures to retail investors, adherence to valuation methodologies, and disclosure of conflicts of interest. This comes as the Department of Labor unveiled a proposed rule in March 2026 to broaden access to private credit through 401(k) plans, simultaneously expanding the retail investor base and amplifying the stakes of any valuation missteps.
Lawsuits filed in 2026 against multiple BDCs allege misstatement of net asset values, delayed recognition of losses, and inadequate valuation processes. In Q1 2026 alone, investors sought to pull an estimated $20 billion from private credit funds; facing sustained redemption pressure that approached structural liquidity limits, several funds invoked gating provisions. Ocorian’s May 2026 survey of 300 private capital executives found that 96% expect PIK prevalence to increase over the next two years, and 90% believe growing PIK usage risks masking underlying borrower stress, a structural opacity concern that regulators are now actively probing.
Implications for Institutional Investors and Operators
For Borrowers (Operators)
- FCCR headroom is tightening. With all-in coupons in the 8%+ range and forward rates flat, borrowers need to demonstrate credible EBITDA growth trajectories to sustain acceptable fixed charge coverage ratios. Lenders are scrutinizing free cash flow generation more intensely than at any point since 2022.
- Covenant and documentation standards are improving, for lenders. Spreads are wider, covenants are tighter, and loan documents have become less borrower-friendly since the trough of late 2024. Borrowers who waited for better terms may find the window has partially closed, particularly in sectors carrying AI, energy cost, or consumer exposure.
- PIK should be treated as a last resort, not a first tool. Mid-life PIK conversions are now directly associated with a 1–2 percentage point increase in the probability of loan delinquency in the following quarter, per FSB analysis. Operators using PIK structures should be prepared for heightened lender scrutiny and potential acceleration of covenant review cycles.
- Sector narrative matters. Lenders are now conducting explicit AI risk assessments as a standard underwriting component. Borrowers in software, technology services, or AI-adjacent businesses must be prepared to articulate how their business model evolves (or prove defensibility) in front of credit committees.
For Institutional Investors and Lenders
- The spread widening is real and yield-enhancing, but selectivity is the premium. Spreads in the S+500 context represent a meaningful recovery from mid-400 bps levels, but the opportunity is asymmetric: managers with dry powder, disciplined underwriting, and experienced restructuring capabilities are positioned to extract superior risk-adjusted returns. Those who over-deployed in 2021–2022 with loose documentation and aggressive leverage are now managing legacy stress.
- Non-accrual and PIK metrics are the primary early-warning indicators. The median non-accrual ratio across the 20 largest BDCs rose 80 basis points in a single quarter to 2.8%, a directional speed that warrants active monitoring. Portfolio-level vintage analysis, with particular attention to 2020–2022 cohorts and software/healthcare exposure, should be a core component of current LP due diligence.
- Regulatory and litigation risk is a new cost of capital. BDCs and private credit managers must now treat SEC examination readiness, NAV valuation documentation, and redemption policy disclosure as first-order operational requirements, not compliance afterthoughts. The litigation wave of 2026 will shape product governance standards for years.
Forward-Looking View: H2 2026 and the Path to Normalization
The second half of 2026 is likely to be defined by three dynamics operating simultaneously. First, deal flow is recovering: M&A activity is improving and LBO volume as a share of total direct lending origination has risen to approximately 40.3% in Q1 2026 from 36.2% in Q4 2025, positive for origination pipelines, though absolute volumes remain below 2022–2023 pace. Second, the deployment gap is the primary structural risk: actual loan origination fell roughly 55% quarter-on-quarter in Q2 to $33.6 billion, creating a widening gap between raised capital and deployed capital that risks pressuring GPs to loosen underwriting standards to meet deployment expectations from their own LPs. The Q2 data suggests that, on balance, direct lenders chose to preserve credit quality over origination volume, but that discipline could erode if the gap persists into Q3–Q4.
Third, the higher-for-longer rate environment remains the overarching constraint. EBITDA-to-interest coverage ratios have improved modestly for credits with strong PE sponsor backing and EBITDA growth, but the FSB has noted that a study of middle-market CLO borrowers found approximately 10% lacked sufficient cash flow to cover interest payments. For the broader middle market, the path to credit normalization runs through EBITDA recovery, and that recovery must outpace the compounding effect of PIK interest and rising principal balances on distressed credits.
The IMF’s 2025 Financial Stability Report found that around 40% of private credit borrowers have negative free cash flow: up from 25% in 2021. Until that ratio reverses meaningfully, default rates and non-accrual levels are unlikely to compress back to the 2023 baseline of ~1.4%. The most durable positioning for the remainder of 2026 is not a broad asset-class bet, but a manager-selection and sector-selection exercise: favoring lenders with the discipline, documentation, and restructuring depth to navigate an environment where the quality of underwriting is finally, definitively, being priced into outcomes.
Key Market Insights
- ● Spread widening is a lender opportunity, not a systemic alarm. Private credit spreads have risen 50–100 bps since late 2025 to the S+500 context, while high-yield spreads have compressed to ~250–270 bps, creating the widest public-private spread differential in several years and enhancing the carry premium for disciplined direct lenders.
- ● Default rates have reached a cycle high of 6.1% (TTM through July 2026), per Fitch. BDC non-accrual rates hit a post-2017 high of 2.8% in Q2 2026. Stress is concentrated in 2021–2022 vintage deals, software, and healthcare, not systemic across the asset class.
- ● PIK usage has risen 67% since early 2022 to ~10% of BDC loans. Mid-life PIK conversions are a statistically significant predictor of delinquency (FSB); the distinction between origination-structured PIK and amendment-triggered PIK is now the most operationally critical underwriting distinction in direct lending.
- ● The Fed SLOOS July 2026 confirms bank C&I standards are stable, but demand diverges sharply by borrower size. Large and middle-market firms are driving stronger C&I demand (16% of banks reporting); small firms remain disengaged (4%). Private credit retains structural advantage in the core middle market.
- ● Regulatory and litigation risk has become a structural cost for BDCs and private credit managers. The SEC’s 2026 examination priorities, the DOL’s 401(k) access rule, and a wave of securities fraud class actions targeting NAV misstatement collectively demand institutional-grade valuation governance, redemption policy transparency, and retail investor disclosure standards, raising the operational bar for all market participants.


