
Bond Capital, Market & Sector Intelligence | August 18, 2026
Private Credit’s Lender-Friendly Reset: Spreads Widen, Capital Gets Selective, and Sector Rotation Accelerates
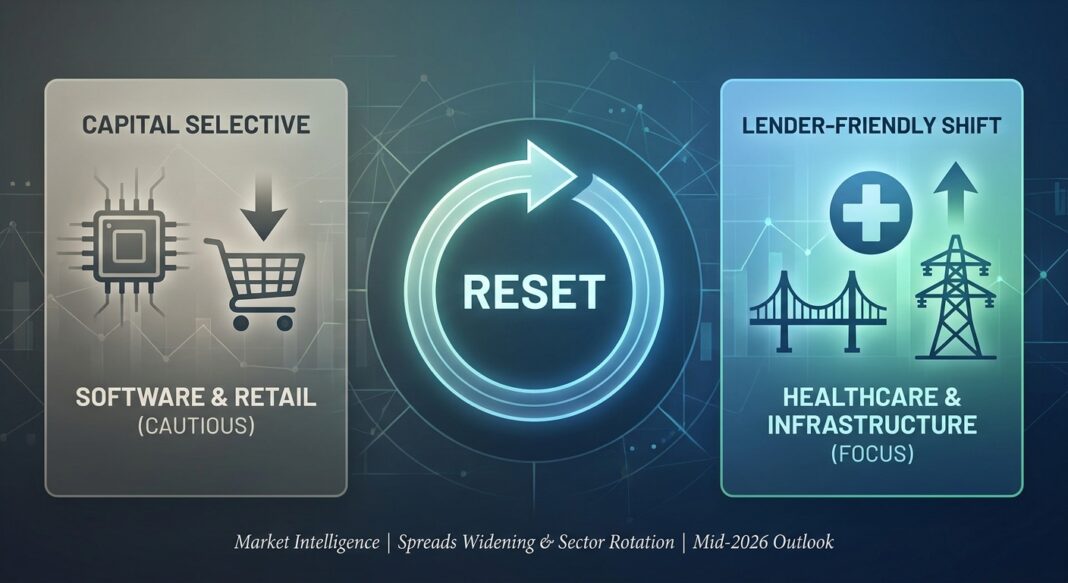
Mid-2026 marks a structural inflection point for private credit markets. Spreads have repriced 50–100 bps wider since late 2025, software has ceded its top spot to healthcare in direct lending issuance, and the Fed’s July SLOOS confirms bank standards are stabilizing, creating a nuanced but increasingly lender-friendly operating environment for disciplined institutional capital.
📊 The Macro Story: A Market That Has Reset
Private credit entered 2026 riding record 2025 origination volumes, only to encounter a triple shock: a U.S.-Iran military conflict that rattled energy and inflation assumptions, an AI-driven reassessment of software credit quality, and a wave of retail-oriented BDC redemptions that exposed structural vulnerability in semiliquid vehicles. The convergence of these forces has produced the most significant repricing event in private credit since the post-GFC era.
The result, as measured at mid-2026, is not a credit crisis; it is a reset. According to Lord Abbett’s 2026 Midyear Outlook, spreads have widened by roughly 50 to 100 basis points since late 2025, covenants and documentation are improving, and capital has become more selective. Critically, the broader M&A transaction engine is still firing: Northleaf Capital reported U.S. M&A/LBO deal volumes in Q1 2026 rose more than 30% year-over-year, even as transaction count declined, reflecting fewer but larger deals.
The Federal Reserve’s July 2026 Senior Loan Officer Opinion Survey (SLOOS) adds an important macro overlay: bank C&I lending standards were broadly unchanged in Q2 2026, a stabilization from the tightening reported in Q1, and demand for C&I loans from large and middle-market firms actually strengthened. This signals that the bank lending channel has not retreated; it has stabilized, keeping competitive pressure alive in the upper middle market even as private lenders reassert discipline in the core and lower segments.
For operators and institutional investors, the overarching message is clear: the second half of 2026 will be defined by dispersion. Manager selection, sector positioning, and underwriting discipline will separate alpha from beta in ways not seen since 2022.
📈 Quantitative Market Snapshot: Key Credit KPIs (As of August 2026)
| Metric | Current Level | Prior Period | Direction | Source |
|---|---|---|---|---|
| Middle Market Private Credit Spreads | S+475–S+525 bps | S+425–S+450 bps (late 2025) | ▲ Wider +50–100 bps | Lord Abbett / PitchBook |
| 3-Month Term SOFR | ~3.68% | ~3.67% (Q4 2025) | ► Flat (Higher-for-Longer) | VRC Q2 2026 |
| 5-Year U.S. Treasury Yield | ~4.23% | ~3.92% (March 2026) | ▲ +31 bps | VRC / Bloomberg |
| Software Sector Secondary Spreads (vs. B-rated loan index) | +229 bps above index | ~+50–70 bps (year-end 2025) | ▲ Dramatically Wider | PitchBook LCD, Jun 2026 |
| Healthcare Direct Lending Spreads | ~S+500 bps | ~S+500 bps (Q4 2025) | ► Stable (No Tightening) | Octus Data |
| Private Credit Est. Default Rate (Direct Lending, 2025) | ~1.6%–4.7% | HY bonds: 3.2% PD (Mar 2026) | ► Elevated / Fragmented | Moody’s, Apr 2026 |
| Fed SLOOS, C&I Standards (Large & Mid-Market Firms) | Net 8.1% tightening (Q2) | Tighter in Q1 2026 | ▼ Stabilizing / Easing | FRED / Fed SLOOS |
The quantitative picture reveals a market in transition. All-in yields on middle market direct loans have climbed materially: with SOFR at ~3.68% and spreads in the S+475–S+525 context, borrowers are facing effective all-in financing costs in the 8.4%–9.2% range for standard senior secured deals. At the same time, Heron Finance’s Q2 2026 benchmark analysis of 69 established private credit funds finds that borrower interest coverage ratios (EBITDA/interest) have improved year-over-year driven by lower interest rates and some EBITDA growth, while loan-to-value (LTV) ratios have remained conservative and stable, indicating lenders have not materially loosened underwriting standards over the past three years.
For operators, the fixed charge coverage ratio (FCCR), a primary gating metric for underwriting, remains under pressure from elevated debt service costs. Lenders are increasingly differentiating between borrowers with durable, recurring free cash flow and those whose coverage relies on optimistic EBITDA add-backs or AI-adjacent revenue assumptions. Lord Abbett specifically cites non-accruals, PIK usage, and 2021–2022 vintage exposure as the clearest leading indicators of portfolio stress heading into H2 2026.
🏥 Sector Analysis: Who’s Hot, Who’s Cold, and the Structural Shifts Beneath
✅ GAINING LENDER APPETITE
Healthcare: The defining sector story of 2026 is healthcare’s ascent. Per PitchBook LCD data, healthcare displaced technology as the sector receiving the largest share of direct lending deployment in Q1 2026, claiming 22% of direct lending issuance YTD through March (up from 18% in 2025) and accounting for 14% of institutional loan volume, its highest share since 2015. Healthcare was also the only major sector that did not experience significant year-over-year spread tightening in 2025, with spreads holding near SOFR+500 bps, according to Octus. The caveat: MSCI research flags that 7.0% of healthcare loans were marked below 80 cents on the dollar at end-2025 (up from 4.5% 18 months prior), reflecting stress in specific sub-segments such as healthcare services and managed care.
Infrastructure, Energy, & Defense: Private credit’s new infrastructure role is accelerating. Priority sectors for 2026 deployment include energy infrastructure, digital infrastructure, defense and national security, and next-generation manufacturing, all requiring patient, long-duration institutional capital that bank lenders cannot efficiently provide. Carlyle’s 2026 Credit Outlook highlights asset-backed finance (ABF) as playing a critical enabling role in sectors like fintech, energy, agriculture, and housing, areas where legacy lending channels have contracted. Global infrastructure deal flow was $1.56 trillion in 2025, and InsuranceAUM’s 2026 Infrastructure Outlook projects sustained deployment driven by AI capacity build-out, grid modernization, and energy security mandates.
Lower & Core Middle Market: Cliffwater data (Q1 2026) reveals a critical diversification dynamic: 80% of lower middle market issuers (<$40M EBITDA) are unique to a single portfolio, versus just 39% of upper middle market issuers (>$100M EBITDA). This means the lower and core middle market offer a structurally differentiated and less competitive opportunity set, a meaningful advantage for managers who can source and underwrite at this level.
❌ FACING TIGHTER CREDIT CONDITIONS
Software & Technology: PitchBook LCD’s Private Credit Market Sentiment Survey found that more than half of respondents are actively reducing their allocation to the software sector, either modestly or significantly. Secondary spreads for software credits are approximately 245 bps wider than year-end levels and roughly 229 bps above the broader B-rated loan index (PitchBook LCD, June 2026). The structural driver is AI disruption risk: agentic AI systems are eroding the competitive moats of general-purpose SaaS models, while seat-based pricing is under pressure. Hamilton Lane draws a critical distinction: lenders in deeply entrenched, mission-critical software with long-term contracts and low LTVs are better positioned; general software models face material risk. BDCs with redemption pressure are functionally exiting new software origination, creating a temporary supply vacuum that disciplined lenders with dry powder can exploit on tighter terms.
Energy-Intensive Industrials & Consumer Retail: Capstone Partners’ Q1 2026 Leveraged Finance Update notes that lenders have responded to elevated energy costs by tightening underwriting standards for energy-intensive industries whose leverage was predicated on stable input costs. Moody’s and S&P Global have flagged legacy media, consumer retail, and healthcare services as carrying elevated downgrade and default risk into H2 2026.
⚖️ Implications: What This Means for Borrowers, Operators, and Investors
🏢 For Business Operators & Borrowers
- All-in costs are higher and likely staying elevated. With 3M Term SOFR at 3.68% and the forward curve broadly flat, floating-rate borrowers should model debt service at current levels through at least mid-2027. FCCR stress-testing at 1.0x–1.25x coverage is increasingly a lender gating threshold.
- Documentation and covenant quality are tightening. Lenders are demanding more conservative leverage structures and tighter covenant packages, particularly for credits with AI, energy, or cycle exposure. Pre-emptive relationship-building with lenders before a specific financing need exists is now a competitive advantage.
- Sector matters more than ever. Healthcare, infrastructure, and defense operators will access broader, more competitive lender pools. Software and consumer-facing businesses must expect longer diligence timelines, heavier information requests, and higher pricing.
💼 For Institutional Investors & Lenders
- The supply-demand balance has shifted in lenders’ favor. More M&A transactions to finance, less capital competing aggressively per deal (due to BDC redemptions), and improved ability to negotiate structure and price; this is the setup Lord Abbett describes as a “lender-friendly reset.”
- Portfolio vintage scrutiny is critical. Non-accruals, PIK usage, and 2021–2022 vintage exposure are the leading stress indicators. Investors should demand transparency on these metrics across manager allocations.
- ABF and infrastructure debt offer structural differentiation. As capital increasingly concentrates in large-cap direct lending, where portfolio overlap is high, asset-backed finance and infrastructure debt provide access to a broader, more differentiated issuer set with duration and return profiles that complement core corporate lending.
The FSB’s May 2026 report on private credit vulnerabilities adds a regulatory lens: banks have tightened standards on loans to non-depository financial institutions (NDFIs) including private equity funds and credit intermediaries, reflecting heightened scrutiny of the interconnectedness between bank balance sheets and private credit structures. The April 2026 SLOOS was the first to include specific NDFI loan questions, signaling increased regulatory attention to the leverage and complexity embedded within private credit ecosystems.
🔭 Forward View: The Next 3–6 Months
VRC’s Q2 2026 update notes that direct lending market conditions stabilized in Q2 following Q1 volatility, with lending activity remaining competitive for higher-quality deals. Banks have gradually returned to the upper middle market, alleviating some upward pressure on spreads in larger transactions. However, Goldman Sachs analysis cited by Markets Media projects that evergreen retail funds in private credit will remain in net outflows throughout 2026 and likely into 2027, a structural headwind that supports deal quality and terms for institutional capital providers with dry powder.
Morgan Stanley Investment Management expects that over time, new deal demand combined with a large refinancing wave will gradually overtake private credit supply: creating an imbalance that allows lenders to preserve discipline, strengthen terms, and capture the illiquidity premium to public markets. McKinsey’s Global Private Markets Report confirms that strategies beyond direct lending (most notably asset-backed finance and credit secondaries) scaled rapidly in 2025 and continue to absorb capital seeking diversification away from a compressed core market. Moody’s projects private credit corporate lending AUM will exceed $2 trillion in 2026 and grow toward $4 trillion by decade’s end, a structural growth trajectory that the current repricing does not derail.
The key risk to this constructive lender-friendly view is a broader economic slowdown catalyzed by persistent inflation, geopolitical escalation, or a more systemic software impairment cycle. State Street’s Q2 Credit Outlook characterizes the current environment as one where geopolitical and energy shocks raise late-cycle risks, but notes that strong bank capital buffers and the predominantly senior secured nature of private credit exposure suggest volatility, not systemic stress, remains the base case.
💡 Key Market Insights: 5 Actionable Takeaways
- Spread reset is real and lender-friendly, but not uniform. Middle market private credit spreads have widened 50–100 bps since late 2025. The repricing is most pronounced in software (+229 bps above B-rated loan index) and most muted in healthcare and infrastructure, where lender appetite remains strong. Operators should expect tiered pricing based on AI exposure, FCCR coverage, and sector classification.
- The Fed SLOOS signals a stable, not retreating, bank lending environment. Q2 2026 bank C&I standards were largely unchanged, and demand from large and middle-market firms is rising. Banks re-entered the upper middle market in Q2, but remain cautious on NDFI lending, a regulatory posture that will shape warehouse and NAV lending structures for private credit funds.
- Healthcare is the new software, but with eyes open. Healthcare has claimed the #1 spot in direct lending issuance (22% YTD through Q1 2026, per LCD). However, sub-sector credit stress is real: 7.0% of healthcare loans were marked below 80 cents at end-2025 (MSCI). Lenders should distinguish between durable healthcare services, pharma, and medtech platforms versus leveraged post-acute care and managed care credits with reimbursement risk.
- Asset-backed finance and infrastructure debt are the structural growth vectors. As large-cap direct lending portfolio overlap intensifies (only 39% of upper-market issuers are unique to one portfolio, per Cliffwater), ABF and infrastructure debt offer genuine diversification, differentiated asset coverage, and access to the $1.5 trillion global infrastructure funding gap driven by AI, grid modernization, and defense spending.
- Manager discipline and vintage analysis are now alpha drivers, not table stakes. The gap between stronger and weaker portfolios will widen as H2 2026 progresses. Non-accrual rates, PIK income as a share of total income, and 2021–2022 vintage concentrations are the most reliable leading indicators of impairment. Institutional allocators should stress-test portfolios against these metrics before committing new capital.


