
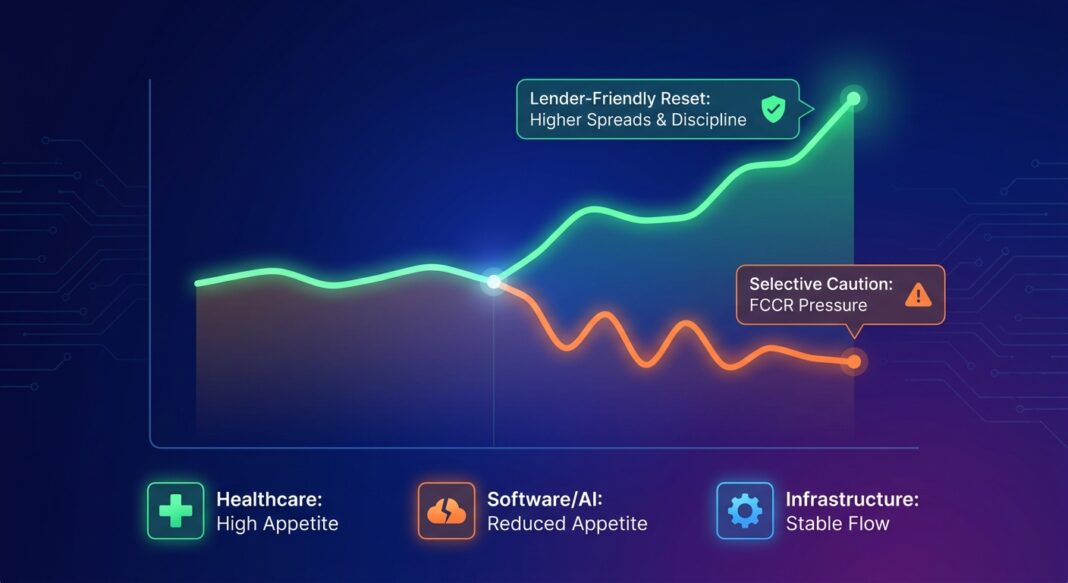
Market Headline: The Lender-Friendly Reset Has Arrived, But Not Evenly
As of August 13, 2026, the private credit market is navigating a structural inflection point. After years of relentless spread compression driven by a capital glut, three converging shocks (a U.S.-Iran military conflict that rattled energy and macro outlooks, an AI-driven reassessment of software credit quality, and a wave of retail redemption requests in non-traded business development companies (BDCs)) collectively jolted the market out of its late-cycle complacency in Q1 2026.
The result, visible now at mid-year, is a bifurcated but fundamentally healthier lending environment. Lord Abbett’s 2026 Midyear Outlook captures the shift precisely: the market has moved toward better documentation, more conservative leverage, and more disciplined underwriting, hallmarks of a mid-cycle correction rather than a systemic breakdown. The operative question for institutional investors and operators is not whether the environment has changed, but where capital is now flowing, on what terms, and against what credit benchmarks.
The macro backdrop reinforces selective caution. SOFR is 3.63% with the FOMC target range held at 3.50%–3.75%, and the forward curve is broadly flat, locking in a higher-for-longer rate regime that continues to pressure interest coverage across leveraged borrowers. Meanwhile, the July 2026 Federal Reserve SLOOS marked a notable pivot: after Q1’s tighter standards, bank C&I lending conditions stabilized and, critically, eased relative to historical norms, creating a new competitive dynamic that private credit managers must navigate head-on.
Quantitative Snapshot: Key Market Metrics (August 2026)
| Metric | Current Value | Prior Period | Direction | Source |
|---|---|---|---|---|
| Overnight SOFR | 3.63% | 3.68% (3M Term SOFR, Q2) | ▼ Marginally lower | NY Fed / SOFRRate.com |
| Middle Market Private Credit Spreads | ~SOFR +500 bps | SOFR +450–475 bps (Q4 2025) | ▲ Widened ~25–50 bps | Hamilton Lane, 2026 |
| Software Sector Secondary Spreads vs. B-Rated Loan Index | ~+229 bps above index | At or near index (YE 2025) | ▲▲ Sharply wider | VRC / PitchBook LCD, June 2026 |
| IG Corporate Bond OAS | +74 bps (Q2 close) | +89 bps (Q1 close) | ▼ 14 bps tighter in Q2 | Breckinridge Capital, Q3 2026 Outlook |
| Private Credit vs. Public High Yield Spread Premium | ~150–200 bps | ~350 bps (2019) | ▼ Significantly compressed | Owners.pe, April 2026 |
| BSL Default Rate (excl. LMEs) | 1.44% (as of March 2026) | Historical GFC peak: 10.8% | → Contained | Goldman Sachs / SEC Filing, 2026 |
| Cliffwater CDLI Realized Loss Rate (FY 2025) | 0.70% | 1.01% long-run historical avg. | ▼ Below long-run avg. | Cliffwater / Dechert, June 2026 |
| 5-Year U.S. Treasury Yield | ~4.23% (June 2026) | 3.92% (March 2026) | ▲ +31 bps QoQ | VRC, Q2 2026 Private Markets Report |
Sources: NY Federal Reserve, VRC, Hamilton Lane, Breckinridge Capital Advisors, Goldman Sachs, Cliffwater, Owners.pe. Data as of most recent available publication through August 2026.
Rate & Coverage Context
With SOFR anchored near 3.63% and the 5-year Treasury pushing 4.23%, all-in private credit yields on new middle-market originations are broadly in the 8.5%–9.5%+ range for senior secured facilities, a level that continues to stress fixed charge coverage ratios (FCCR) for borrowers underwritten at sub-2% rate assumptions. Lincoln International data showed the average FCCR for private credit borrowers declining from 1.40x in Q1 2022 to just 1.04x at peak SOFR stress, and while rate cuts provided partial relief, borrowers from 2019–2022 vintages carrying aggressive leverage structures remain at elevated risk of falling below the critical 1.0x coverage threshold. Lenders are now explicitly flagging FCCR floors and demanding greater sensitivity analysis in underwriting submissions.
Loan-to-value ratios, however, have held. Heron Finance’s Q2 2026 benchmark analysis of 69 global private credit funds confirms that LTV ratios remain conservative and stable across segments, a meaningful buffer. Interest coverage has also improved year-over-year on the back of lower rates and some EBITDA growth, though dispersion across manager vintage is widening.
Sector Analysis: Capital Is Rotating, Know Where It’s Going
🟢 High Lender Appetite
Healthcare: Octus data confirms healthcare led all sectors in private credit deal volume in 2025, accounting for 19% of all direct lending transactions. Critically, it was also the only major sector to not experience significant year-over-year spread tightening, with spreads averaging approximately SOFR+500 bps in Q4 2025, a premium reflecting both lender conviction and deal complexity. Specialist healthcare credit funds have posted median net IRRs of 15% vs. 11% for generalist U.S. direct lending funds (bfinance data), driven by demographic durability, non-cyclical cash flows, and active platform consolidation. PE sponsors continue to vertically integrate healthcare supply chains, generating consistent deal flow for direct lenders.
Energy Infrastructure & Digital Infrastructure: Paul Weiss’s 2026 outlook identifies energy infrastructure, digital infrastructure, defense, and next-generation manufacturing as priority sectors requiring patient institutional capital. Morgan Stanley estimates that private credit could supply more than half of the $1.5 trillion required for global data center buildouts through 2028, a structural origination opportunity of historic scale. Utilities are also increasingly engaging private credit providers to fund large-scale infrastructure capex, according to S&P Global Market Intelligence.
🔴 Reduced or Conditional Appetite
Software & Technology Services: This is the defining fault line of 2026. VRC reports that secondary spreads in the software sector are approximately 245 basis points wider than year-end levels and roughly 229 basis points above the broader B-rated loan index as of June 2026, a historically extreme dislocation driven by AI disruption fears. Moody’s has flagged that software represents roughly 25% of BDC portfolios on a median basis, though it notes that software loan maturities do not increase meaningfully until 2028–2029, suggesting AI-related credit risk remains a monitoring issue rather than an immediate default catalyst. Still, S&P Global confirms private credit lenders are actively reducing new exposure to software-related debt.
Energy-Intensive Industrials: Capstone Partners’ Q1 2026 Leveraged Finance Update documents how lenders tightened underwriting standards specifically for energy-intensive industries following geopolitical-driven oil price volatility, with leverage structures previously calibrated to stable energy costs now subject to renegotiation and enhanced sensitivity analysis.
Office CRE: S&P Global notes that private credit appetite for office assets has diminished materially, as lenders reduce exposure amid uncertainty over future demand. CRE lenders overall are easing standards for the first time since early 2022 on non-office property, per the July 2026 SLOOS, but office remains structurally challenged.
Structural Shift: The Lower Middle Market’s Differentiation Premium
Capital concentration at the top of the market has created a structural anomaly that sophisticated lenders are exploiting. Cliffwater data as of Q1 2026 reveals that only 39% of upper middle market issuers (over $100M EBITDA) are unique to a single lending portfolio, compared with 80% of lower middle market issuers (under $40M EBITDA). The lower and core middle market offer a genuinely differentiated and less competitive opportunity set, with stronger documentation leverage, less overlap, and more authentic illiquidity premium capture.
Implications: What This Means for Borrowers, Operators, and Investors
For Institutional Borrowers and Operators
The era of unchallenged borrower-friendly terms in large-cap direct lending is moderating. Lord Abbett’s midyear analysis confirms that better documentation, more conservative leverage, and deeper stress analysis are becoming standard features of new loan originations. Operators should prepare for enhanced diligence around FCCR minimums (expect floors of 1.10x–1.25x on new money), leverage covenant step-downs tied to EBITDA milestones, and sector-specific AI-exposure questionnaires now embedded in underwriting processes as standard. Any company with material software, SaaS, or AI-enabled service revenue should expect to address the disruption question explicitly in the lender presentation, not as a checkbox, but as a substantive valuation discussion.
Operators in healthcare, infrastructure, and defense sectors are positioned advantageously. PineBridge and others are actively targeting what they describe as “boring and basic” businesses (those with stable, long operating histories and demonstrated multi-cycle resilience) with competitive terms and deal certainty.
For Institutional Investors and Lenders
The July 2026 SLOOS delivered a pivotal data point: the Federal Reserve confirmed that bank lending standards for C&I loans are now easier than the midpoints of their historical ranges for syndicated/club loans to investment-grade firms and non-syndicated loans to large and middle-market firms, and that standards have eased across all C&I loan types relative to July 2025. This is meaningful competitive pressure on upper middle market private credit, particularly for high-quality credits. However, the April 2026 SLOOS also revealed that banks are tightening standards specifically for non-depository financial institution (NDFI) loans (including to private equity funds and business credit intermediaries) a structural constraint on leverage-upon-leverage strategies.
For investors, the spread compression story still warrants sober evaluation. The premium over public high yield has compressed from ~350 bps in 2019 to ~150–200 bps today, still positive, but meaningfully reduced. Investors must reassess whether remaining premium adequately compensates for illiquidity (75–150 bps implied in normal markets), information asymmetry, concentration, and valuation uncertainty.
Deal flow is recovering on the right metrics. VRC notes that middle market PE deal value increased approximately 10.7% year-over-year with exit activity up 14%, while Northleaf reports U.S. M&A/LBO deal volumes in Q1 2026 increased more than 30% versus the prior year. The composition of proceeds is also normalizing: buyout financing, the highest-value use of private credit capital, now accounts for 44% of volume, up from 32% a year prior, though still well below the 61% peak of 2021.
Forward-Looking View: The Next 3–6 Months
The market setup heading into Q3–Q4 2026 is constructive for disciplined, experienced managers with lower-middle-market origination capabilities and sector specialization. Lord Abbett expects the gap between stronger and weaker portfolios to become more visible as the year progresses, with non-accruals, PIK usage, sector concentration, and 2021–2022 vintage exposure serving as the key differentiators. Morgan Stanley IM projects that growing new deal demand and a large refinancing wave will gradually overtake private credit supply: creating the conditions for lenders to preserve discipline, strengthen terms, and more fully capture the illiquidity premium to public markets.
PwC’s 2026 Private Credit Survey identifies the key strategic adaptation: capital is shifting toward specialist strategies including asset-backed finance, non-sponsor lending, and selective leverage, with managers accepting greater structural complexity in exchange for differentiated returns. The $1.5–$2 trillion direct lending market is projected to reach $3 trillion by 2028, per Cleary M&A Watch, but the path there will reward selectivity, documentation discipline, and sector expertise over scale alone.
Key Market Insights
- Spreads have reset higher, but not uniformly: Middle market private credit spreads have returned to the SOFR+500 bps context following Q1 volatility, a yield-enhancing development for new originations, but software sector secondaries are trading at extraordinary dislocations of ~229 bps above the B-rated index, creating both risk and opportunity depending on vintage and underwriting quality.
- FCCR is the critical KPI watchpoint: With SOFR holding near 3.63% and 5-year Treasuries at 4.23%, all-in borrowing costs continue to pressure interest coverage. Lenders are now standardizing FCCR minimums in the 1.10x–1.25x range on new money, and any borrower with 2019–2022 vintage debt at sub-1.10x coverage should be viewed as a near-term refinancing or restructuring candidate.
- Bank competition is real, but structurally bounded: The July 2026 SLOOS confirms banks have eased C&I standards to below historical midpoints, re-entering the upper middle market. However, banks are simultaneously tightening NDFI lending standards, constraining leverage available to private credit funds themselves, a dynamic that limits how aggressively banks can compete at the platform level.
- Sector rotation is accelerating: Healthcare (SOFR+500 bps, 15% specialist fund IRR), digital infrastructure, energy infrastructure, and defense are attracting disproportionate lender appetite and competitive terms. Software, AI-exposed tech services, and office CRE face elevated risk premiums and reduced lender conviction, a bifurcation that will directly impact borrower costs and deal availability by sector through year-end.
- Lower middle market offers the most authentic illiquidity premium: With 80% of lower middle market issuers unique to a single lending portfolio versus only 39% in the upper market, core and lower middle market lenders retain genuine information advantage, covenant strength, and spread premium. For investors evaluating private credit allocations, manager focus on this segment, rather than large-cap club deals that effectively replicate BSL market dynamics, is the most defensible source of differentiated return in the current environment.


