
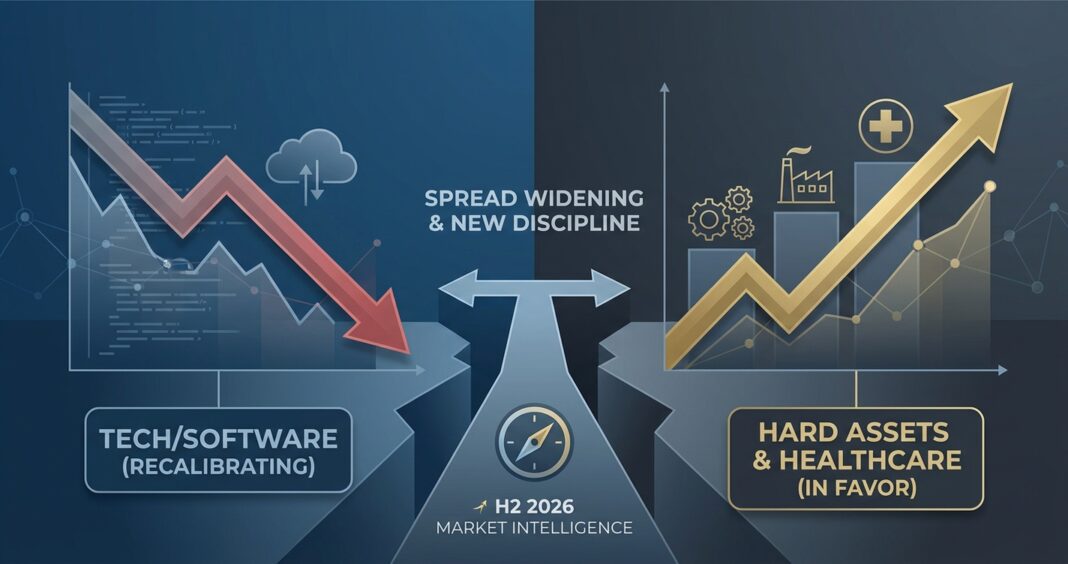
The Mid-Cycle Reset: Private Credit Reprices as Volatility, AI Disruption, and Bank Tightening Converge
The U.S. private credit market entered the second half of 2026 in a state of deliberate recalibration. Three converging forces (geopolitical shock (the U.S.-Iran conflict of February 2026), an AI-driven reassessment of software credit quality, and structural redemption pressure on retail-oriented BDCs) pulled the market out of the spread-compression trade that dominated 2024 and most of 2025. According to PitchBook data cited by Lord Abbett, spreads have widened by roughly 50 to 100 basis points since late 2025, while defensive documentation terms have simultaneously improved, a combination that has not been seen since the post-COVID normalization window.
This is not a systemic credit crisis. PitchBook LCD’s Q2 2026 wrap confirms that direct lending volumes fell sharply in Q2-$29.2 billion across 138 transactions through June 22, compared to $74.1 billion across 217 deals in Q1, the strongest quarter in two years, but the market remained open. Instead, what is unfolding is a classic mid-cycle bifurcation: high-quality borrowers with strong fixed-charge coverage ratios and defensible EBITDA still attract competitive capital, while AI-exposed software credits, highly leveraged legacy portfolio companies, and energy-cost-sensitive industrials face measurably wider spreads and tighter structural terms. The defining question for H2 2026 is not whether credit remains available, it does, but at what price, to whom, and on what terms.
Quantitative Market Snapshot: As of July 24, 2026
The table below synthesizes the most current available data points across rates, spreads, deal activity, and credit quality indicators.
| Metric | Current Value (Q2 2026) | Prior Period Comparison | Source |
|---|---|---|---|
| Overnight SOFR | 3.62% (July 22, 2026) | ~3.68% (3-Month Term SOFR, June 2026); 5-Yr UST at 4.23% vs. 3.92% in March | SOFR Rate / NY Fed; VRC Q2 2026 |
| Middle Market Direct Lending Spreads (LBO / Unitranche) | SOFR + ~500 bps (S+509 on recent LBOs) | S+474 in Q1 2026; mid-400s bps in late 2025 | PitchBook LCD, June 2026; Hamilton Lane |
| Software Sector Secondary Spreads (B-rated) | ~245 bps wider than year-end 2025; ~229 bps above broader B-rated loan index | Leveraged loans to software businesses trading down ~8% since Q4 2025 | PitchBook LCD via VRC, June 19, 2026; Carlyle AlpInvest Q2 2026 |
| B-Minus Broadly Syndicated Loan Spreads | S+409 (+55 bps Q2 widening); B-rated secondary spreads ~67 bps wider than year-end 2025 | Higher-rated borrowers: spreads largely unchanged, underscoring bifurcation | Sikich Q2 2026 Credit Market Update; VRC Q1 2026 |
| U.S. Direct Lending Deal Volume | Q2 2026 (through June 22): $29.2B across 138 transactions | Q1 2026: $74.1B across 217 deals (best quarter in 2 years); Q1 volume +26% YoY | PitchBook LCD, June 2026; Carlyle AlpInvest / PitchBook LCD, April 2026 |
| Private Credit AUM (Corporate Lending) | Exceeding $2 trillion in 2026; global total ~$3.2T (inc. semi-liquid vehicles) | $2.1T estimated at year-end 2025; forecast to approach $4T by 2030 | Moody’s 2026 Outlook; PIMCO, June 2026 |
| Estimated Private Credit Default Rate (2025) | ~1.6%–4.7% (excl. distressed exchanges); U.S. HY PD: 3.2% (March 2026) | All U.S. listed company avg. 1-yr PD: 7.9% (March 2026), down from 9.1% a year prior | Moody’s, April 2026 |
| Fed SLOOS: C&I Bank Lending Standards (Q1 2026) | Net tightening for C&I loans to firms of all sizes; NDFI loan standards also tighter on net | Q4 2025: modest net share (5–10%) tightened C&I standards; demand broadly unchanged | Federal Reserve April 2026 SLOOS |
Note: “S+” denotes spread over SOFR in basis points. All-in yields on senior secured direct lending facilities approximate SOFR (3.62%) plus applicable credit spreads. A deal priced at S+500 currently carries an all-in yield of approximately 8.6% before fees.
Sector Analysis: Capital Flows to Hard Assets as Software Faces Structural Reckoning
🔴 Under Pressure: Software & Technology Services
Software is the most consequential credit story of 2026. Per Sikich’s Q2 2026 credit update, software’s share of broadly syndicated loan issuance collapsed to just 8.8% year-to-date, down from 17.6% in all of 2025 and its lowest level since 2013. The culprit is structural, not cyclical: AI tools capable of replicating core software functions are forcing a fundamental reassessment of recurring revenue durability and competitive moat, the two pillars upon which ARR-based underwriting frameworks were built. Capstone Partners notes that AI risk assessment has become a mandatory analytical component in both new underwriting and portfolio monitoring. Lenders demanding higher spreads and tighter covenants on software credits are not overreacting; they are repricing structural uncertainty that was previously invisible.
🟢 In Favor: Healthcare, Spreading Its Wings
Healthcare became the largest sector for institutional loan issuance for the first time since 2015, capturing a record 12.4% of volume in the year-to-date period. This is consistent with longer-term structural demand: Octus data shows healthcare led all 2025 direct lending activity at 19% of deals, with spreads averaging approximately SOFR+500 bps in Q4 2025, notably, the only major sector that did not experience meaningful price tightening. Demographic tailwinds, non-cyclical cash flows, and government-backed reimbursement mechanisms continue to give healthcare businesses defensible FCCR profiles. That said, Morgan Stanley Investment Management flags healthcare as the leading sector for non-accrual loans over the past year, a reminder that subsector and vintage selection within healthcare remain essential.
🟢 Rising: Industrials, Energy, Utilities & Hard-Asset Sectors
The most pronounced structural shift in 2026 is capital rotating into what Carlyle AlpInvest calls the “hard-asset” economy. Utilities, energy, chemicals, and machinery accounted for 46% of buyout transaction volumes in Q1 2026, compared to just 13% a year earlier. This rotation reflects both supply-side dynamics (AI-disruption fears driving investors away from asset-light software) and demand-side shifts (infrastructure buildout, energy security, and onshoring investment). Lender appetite for hard-asset borrowers with tangible collateral bases, predictable capex cycles, and government-linked revenue streams is strong, and underwriting standards in this cohort have been less aggressive than in software over the prior cycle.
🟡 Cautious: Energy-Intensive Industrials
While the industrial sector broadly benefits from the hard-asset rotation, Capstone Partners notes that lenders are tightening underwriting standards specifically for energy-intensive businesses whose leverage was predicated on stable fuel and feedstock costs. The Iran conflict-related oil price shock introduced meaningful sensitivity into cost-side modeling for sectors like chemicals, transportation, and manufacturing logistics. Borrowers in these categories should expect lenders to run downside oil-price scenarios as part of base-case underwriting into year-end 2026.
Implications for Borrowers & Institutional Investors
For Borrowers & Operators
Credit availability is bifurcating by quality, not contracting overall. VRC Q2 2026 confirms that lending activity remains competitive for higher-quality deals despite elevated redemption activity. The operative KPI thresholds have shifted: lenders are requiring more robust fixed-charge coverage ratios, generally seeking FCCR of at least 1.20x on a stressed basis, and are pushing back on leverage multiples that exceed 5.5x Debt/EBITDA for non-defensive sectors. Borrowers with stable LTV ratios and improving interest coverage ratios (EBITDA/interest) driven by modest EBITDA growth will continue to find competitive pricing. Those carrying covenant-lite 2021–2022 vintage debt with stretched leverage multiples face the most acute refinancing risk, particularly with the 5-year U.S. Treasury at 4.23% creating upward pressure on all-in cost of capital.
Operationally, sponsors and borrowers should prioritize: (1) strengthening financial reporting to support credible forward EBITDA projections; (2) explicit AI risk assessments in offering memoranda for any tech-adjacent business; and (3) presenting clear documentation of energy cost pass-through mechanisms for industrial borrowers. Sikich notes that sponsors who used the slower Q2 environment to improve operating performance and financial reporting continue to find capital available on attractive terms.
For Institutional Investors & Lenders
The current environment is generating the best risk-adjusted entry points in the direct lending market since 2022. Lord Abbett’s midyear outlook observes that spread widening is only part of the story: improved covenants, better documentation, and more conservative leverage multiples are compounding the structural improvement in new vintage risk-adjusted returns. Managers deploying dry powder now are doing so with greater selectivity and stronger protections than at any point in the last three years.
Portfolio monitoring priorities include: PIK income as a percentage of total investment income (an early stress indicator), non-accrual trends by sector (healthcare and software warrant heightened scrutiny), and 2021–2022 vintage loan maturities approaching over the next 18–24 months. Moody’s flagged that evolving structures (covenant-lite documentation, PIK income, NAV-based lending, and layered fund-level leverage) can obscure underlying leverage and complicate market-wide default estimation, making bottoms-up portfolio transparency a competitive advantage rather than an operational choice.
Forward-Looking View: H2 2026 Liquidity & Lending Dynamics
Market expectations reflect a higher-for-longer rate environment, with the forward curve broadly flat as of June 2026 and the FOMC widely expected to leave the federal funds rate unchanged at its July 28–29 meeting. With overnight SOFR at 3.62% and the 5-year Treasury at 4.23%, all-in borrowing costs for middle-market direct lending deals at S+500 remain elevated near 8.6%, a level that meaningfully stress-tests coverage ratios for companies with thin free cash flow generation.
Three themes will define H2 2026 credit conditions: First, M&A pipeline recovery: middle market PE deal value rose 10.7% YoY with exit activity up 14%, signaling gradual normalization that should support direct lending volumes in Q3–Q4. Second, bank re-entry: banks have gradually returned to the upper middle market since June 2026, introducing competition that should partially compress spreads for the highest-quality credits while leaving the core middle market as private credit’s most defensible territory. Third, secondary market maturation: PitchBook LCD documents an unprecedented expansion of private credit secondary loan trading in 2026, driven by BDC redemption pressure, with loans trading at discounts of 3 to over 10 cents below par in some cases. This creates a new alpha source for well-capitalized buyers with the analytical infrastructure to underwrite at speed.
Moody’s forecasts private credit AUM approaching $4 trillion by 2030, with the growth mix shifting increasingly toward asset-backed finance (ABF) as banks continue offloading portfolio assets through forward-flow agreements. With European Basel IV implementation accelerating bank disintermediation and ELTIF 2.0 opening new capital pools, the structural runway for private credit (particularly in Europe and across ABF) remains among the most compelling in alternative assets.
📈 Key Market Insights for Bond Capital Readers
- Spread widening is a feature, not a bug. The 50–100 bps of spread expansion since late 2025 (per PitchBook / Lord Abbett) represents improved entry economics for new vintage direct lending, not systemic stress. Managers deploying capital now are capturing both wider spreads and better documentation, a dual improvement not seen since early 2023.
- Software credit risk is structural, not cyclical. Secondary spreads on software loans are 245 bps wider than year-end 2025 and 229 bps above the broader B-rated loan index (PitchBook LCD, June 2026). AI disruption of legacy software revenue models demands a permanent recalibration of ARR-based underwriting, higher equity cushion requirements, and stricter covenant maintenance for the sector.
- Healthcare and hard-asset industrials are the new core allocation. Healthcare commands 12.4% of institutional loan issuance (a 2015 record), while utilities, energy, chemicals, and machinery made up 46% of Q1 2026 buyout volumes (Carlyle AlpInvest). Lenders and investors seeking durable FCCR coverage and collateral-backed structures should concentrate new commitments in these verticals.
- Bank tightening is a private credit tailwind, with a nuance. The April 2026 Fed SLOOS confirms continued net tightening of C&I lending standards for firms of all sizes. However, banks are selectively re-entering the upper middle market for high-quality transactions, heightening competition at the top of the credit quality spectrum. The core middle market ($25M–$100M EBITDA) remains private credit’s most defensible competitive territory.
- BDC redemption pressure is creating secondary market opportunity. The unprecedented volume of loans offered on secondary by private credit managers facing redemption queues, some trading at 3–10+ cents below par (PitchBook LCD), represents a time-sensitive alpha opportunity for institutional buyers with the capital and analytical capacity to underwrite quickly. This secondary dynamic may persist through at least Q3 2026 as semi-liquid vehicle structures continue to face structural stress testing.
Data Sources: Federal Reserve April 2026 SLOOS (federalreserve.gov); PitchBook LCD Q2 2026 Wrap (pitchbook.com); Valuation Research Corporation Q2 2026 Private Markets Update (valuationresearch.com); Carlyle AlpInvest GPMQ Q2 2026 (carlyle.com); Lord Abbett 2026 Midyear Outlook (lordabbett.com); Sikich Q2 2026 Credit Market Update (sikich.com); Hamilton Lane 2026 Private Credit Focus (hamiltonlane.com); Moody’s U.S. Corporate Default Risk in 2026 (moodys.com); Capstone Partners Q1 2026 Leveraged Finance Update (capstonepartners.com); Heron Finance Q2 2026 Private Credit Benchmark Report (heronfinance.com); Octus Americas Private Credit 2026 Outlook (octus.com); Northleaf Capital Q1 2026 Market Update (northleafcapital.com); PIMCO Private Credit TAM Analysis, June 2026 (pimco.com); Cleary Gottlieb 2026 Private Credit Outlook (clearygottlieb.com); With Intelligence Private Credit Outlook 2026 (withintelligence.com); NY Fed / SOFR Rate (sofrrate.com); StreetStats Fed Funds Rate (streetstats.finance); FSB Report on Vulnerabilities in Private Credit, May 2026 (fsb.org); Morgan Stanley IM 2026 Private Credit Outlook (morganstanley.com).
Published by Bond Capital, Market & Sector Intelligence Desk | July 24, 2026. All data cited from third-party sources and used for informational purposes only.


