
The Main Story: A Credit Market Running Hot, With Fault Lines Beneath the Surface
Private credit is entering the second quarter of 2026 at a pivotal inflection. After two years of elevated base rates and disciplined underwriting, capital has flooded back into direct lending with a velocity that is visibly compressing spreads across the middle market. Middle market all-in yields have declined from roughly SOFR + 600–675 basis points in mid-2025 to approximately SOFR + 550–625 basis points today: a compression of 50–75 bps in under six months, as institutional allocators chase yield in a market where high-yield bond spreads have simultaneously tightened toward post-2022 lows near 280–310 basis points over Treasuries, per ICE BofA index data tracked by the Federal Reserve.
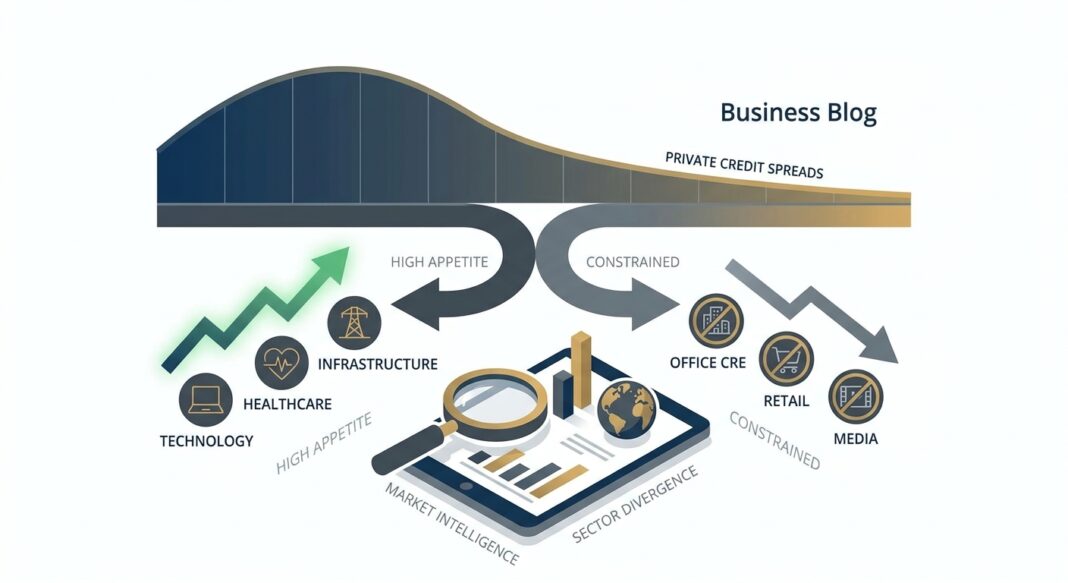
Yet the headline spread story conceals a more consequential shift: lender appetite is fracturing along sector lines. Technology, healthcare services, and infrastructure-adjacent businesses are attracting aggressive pricing and elevated leverage tolerances. By contrast, office commercial real estate, consumer discretionary retail, and highly levered media assets are experiencing de facto credit rationing: tighter covenant packages, reduced leverage ceilings, and, in some cases, outright lender withdrawal. The credit cycle, while not yet signaling systemic stress, is no longer monolithic. Operators and institutional investors who treat today’s market as uniformly permissive do so at material risk.
The macro context matters. The Federal Reserve’s pause-and-hold posture on the federal funds rate, following its 2024–2025 easing cycle that brought the target range to approximately 4.00–4.25%, has stabilized base rates enough to allow all-in pricing visibility, while SOFR continues to anchor floating-rate private credit structures. The Federal Reserve’s Senior Loan Officer Opinion Survey (SLOOS) for Q4 2025 confirmed a modest but meaningful easing in commercial and industrial lending standards at large domestic banks, the first sustained easing since the 2022–2023 tightening cycle peak. This bank re-entry is creating competitive dynamics in upper-middle market deals above $75 million EBITDA, while private credit retains a commanding structural advantage in the sub-$50 million EBITDA segment where bank appetite remains episodic.
Quantitative Market Snapshot: Key Credit Metrics as of Q1 2026
The table below synthesizes the most current available data points across public and private credit markets, providing a side-by-side view of where pricing, leverage, and credit quality metrics stand today versus six months prior.
| Metric | Current (Q1 2026) | Prior Period (Q2 2025) | Δ Change | Source |
|---|---|---|---|---|
| Middle Market Direct Lending Spread | SOFR + 550–625 bps | SOFR + 600–675 bps | ▼ ~50–75 bps | Cliffwater Direct Lending Index |
| Middle Market All-In Yield (est.) | ~9.5–10.5% | ~10.2–11.2% | ▼ ~60–80 bps | Pitchbook LCD / Cliffwater |
| U.S. High Yield Bond Spread (OAS) | ~280–310 bps | ~330–360 bps | ▼ ~50 bps | ICE BofA via FRED / Bloomberg |
| Sponsor-Backed MM Leverage Multiple | 5.0–5.5x Total Debt/EBITDA | 4.5–5.0x | ▲ ~0.5x | Pitchbook LCD Q4 2025 |
| FCCR Floor (Typical Credit Agreement) | 1.10–1.20x minimum | 1.15–1.25x minimum | ▼ Modest easing | Pitchbook LCD / Market Practice |
| Private Credit AUM (Global) | >$1.7 Trillion | ~$1.5 Trillion | ▲ ~13% YoY | Preqin Q4 2025 |
| Direct Lending Annualized Loss Rate | ~0.8–1.2% | ~1.0–1.4% | ▼ Modest improvement | Cliffwater CDLI Q3 2025 |
| S&P Leveraged Loan Default Rate (TTM) | ~2.1% | ~2.8% | ▼ Improving | S&P Global Ratings LCD Q4 2025 |
Note: Spread and yield data reflect broadly observable market ranges derived from index and survey data. Individual deal economics will vary by issuer quality, sector, and structure.
The private credit premium over broadly syndicated loans (BSL), which price at roughly SOFR + 275–300 bps for upper-market credits per Pitchbook LCD, remains approximately 250–325 basis points. This illiquidity premium, while compressed from its 2023 peak of ~350+ bps, continues to justify private credit allocations for yield-seeking LPs who can tolerate lock-up periods. Critically, the relative value equation still favors direct lending over public high yield on a risk-adjusted basis, given private credit’s structural protections: first-lien security, tighter covenants, and lender-of-record control rights.
Sector Analysis: Bifurcated Lender Appetite and Structural Market Shifts
The most operationally significant story in Q1 2026 is not aggregate spread compression; it is the widening divergence in lender appetite across sectors. Understanding this bifurcation is essential for operators seeking to time and structure debt raises.
High-Conviction Sectors: Where Capital Is Flowing
Technology & Software (SaaS): Recurring revenue models with demonstrable net revenue retention above 110% continue to command the most aggressive terms in the direct lending market. Lenders are accepting 5.25–5.75x leverage on quality software platforms, with spreads compressing roughly 25–40 bps over the past 12 months, per Pitchbook LCD sector data. ARR-based lending structures, where loan sizing is tied to annual recurring revenue rather than EBITDA, are now standard underwriting practice for pre-profitability SaaS companies seeking growth capital.
Healthcare Services: Demand-inelastic revenue, favorable demographic tailwinds, and mission-critical care delivery models are sustaining strong lender appetite. Specialty physician groups, behavioral health platforms, and outpatient surgical centers are attracting competitive terms from both bank and non-bank lenders. Leverage tolerances in healthcare services are holding near 5.0–5.5x, with FCCR floors modestly relaxed to 1.10–1.15x given the predictability of reimbursement-backed cash flows, per market practice data tracked by industry practitioners and sector analysts.
Infrastructure-Adjacent & Energy Transition: Digital infrastructure (data centers, fiber networks, cell towers) and energy transition assets are drawing significant interest from both traditional infrastructure lenders and crossover private credit funds. The structural tailwind from AI-driven data center buildout is creating a robust pipeline of asset-backed lending opportunities with long-duration contracted cash flows, a profile that naturally extends lender comfort to higher leverage and tighter pricing.
Constrained Sectors: Where Lenders Are Pulling Back
Office Commercial Real Estate: Occupancy uncertainty, hybrid work’s structural permanence, and looming maturity walls have resulted in near-universal credit rationing from traditional lenders. Private bridge lenders remain active but are requiring significant equity cushions (LTV ceilings of 55–60%), shortened loan terms, and recourse guarantees, per MSCI Real Estate market data.
Consumer Discretionary Retail: Lenders are scrutinizing same-store sales trends, inventory turn efficiency, and lease liability exposure with heightened rigor. Leverage ceilings have effectively compressed to 3.5–4.0x for non-essential retail, with FCCR minimums holding firm at 1.25x or above. Private credit funds active in this space are demanding tighter amortization schedules and sweeps of excess cash flow.
Highly Levered Legacy Media: Traditional broadcast and print assets face structural revenue deterioration that most credit committees now view as secular, not cyclical. New money from private credit into this sector has materially declined, with most activity confined to distressed-oriented funds repricing existing exposure.
Implications for Institutional Investors and Operators
For Borrowers and Operators
The spread compression environment creates a favorable refinancing window for operators in high-conviction sectors, particularly those carrying debt originated at SOFR + 650+ bps during the 2022–2023 tightening cycle. A proactive refinance at today’s SOFR + 575 bps mid-market level could meaningfully reduce cash interest burden and improve FCCR headroom. However, operators should move with deliberate urgency: if the Federal Reserve pivots to further rate cuts or if credit conditions soften materially, the competitive dynamic may shift, but the window of optimal execution is most likely H1 2026 based on current pipeline visibility.
Operators in constrained sectors face a fundamentally different calculus. With bank lending standards tighter and private credit pricing elevated for perceived cyclical or structurally challenged industries, the cost of marginal debt capital is rising even as headline market spreads compress. These operators should stress-test capital structures at leverage multiples 0.5–1.0x below current debt loads and ensure FCCR coverage does not fall below 1.20x under a base-case downside scenario.
For Institutional Investors and LPs
The private credit illiquidity premium, while compressed from peak, remains structurally intact and continues to offer meaningful yield pickup over comparably rated public credit. Preqin’s Q4 2025 data shows global private credit AUM exceeding $1.7 trillion, underscoring that institutional capital has already voted decisively on this asset class. The incremental allocation question for LPs is now one of manager selection and sector exposure rather than asset class inclusion. Vintage diversification across 2024–2026 vehicles is advisable given the spread compression visible in new deals, which may compress forward IRRs for strategies underwriting at today’s tighter levels relative to 2022–2023 vintages.
Direct lending annualized loss rates near 0.8–1.2% per the Cliffwater Direct Lending Index, well below the S&P leveraged loan default rate of ~2.1%, continue to validate private credit’s structural protections and lender-of-record advantages. Investors should nonetheless scrutinize portfolio-level PIK income accrual, which, if elevated, may signal underlying borrower cash flow stress being masked by non-cash interest payments.
Forward-Looking View: Next 3–6 Months
The consensus expectation among credit market participants is that spread compression will moderate but not reverse through mid-2026, absent a material macro shock. Deal volume in sponsor-backed middle market transactions is expected to remain elevated as private equity firms, sitting on record levels of dry powder, accelerate deployment after years of transaction hesitancy. The reactivation of the M&A cycle will be the primary deal flow driver for direct lenders in Q2–Q3 2026. Bank re-entry into upper-middle market C&I lending introduces competitive pressure on pricing but is unlikely to displace private credit in the sub-$50 million EBITDA core middle market, where speed-to-close, structuring flexibility, and relationship continuity remain decisive advantages.
Key Market Insights
- Spread compression is real but sector-dependent: Middle market direct lending spreads have tightened 50–75 bps over six months, but operators in office CRE, consumer retail, and legacy media are experiencing effective credit tightening despite headline market loosening.
- Leverage multiples are creeping higher in sponsored deals: Sponsor-backed middle market transactions are clearing at 5.0–5.5x total debt/EBITDA, up from 4.5–5.0x in early-to-mid 2025, signaling growing competitive pressure among lenders for quality assets; borrowers should use this leverage tolerance strategically, not reflexively.
- FCCR floors are modestly relaxing but remain a binding covenant: Lenders are accepting 1.10–1.15x FCCR minimums in high-quality sectors, but operators should model a 1.20x+ cushion as a prudent internal threshold to preserve lender relationships and refinancing optionality.
- Private credit’s illiquidity premium remains intact: The ~250–325 bps spread premium of direct lending over BSL continues to support the asset class’s risk-adjusted value proposition, even as absolute yields decline; LP vintage diversification across 2024–2026 vehicles is the recommended portfolio strategy.
- PIK income and default rate divergence warrant scrutiny: The gap between direct lending’s low annualized loss rate (~0.8–1.2%) and the BSL default rate (~2.1%) reflects structural protections, but investors should monitor PIK accrual levels within BDC and direct lending fund portfolios as a leading indicator of latent credit stress before it manifests in realized losses.


