
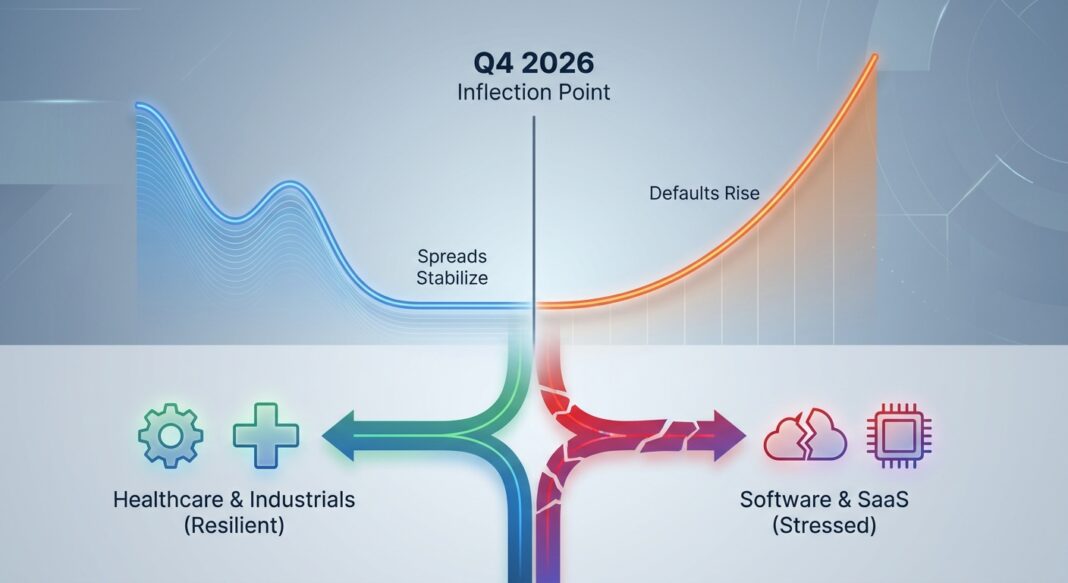
Market Headline: A Lender-Friendly Reset Interrupted by Bifurcation
Private credit enters the final quarter of 2026 at a genuine inflection point. After years of spread compression fueled by a capital wave that reached record highs in 2025, the market is now repricing, but not uniformly. The headline story is bifurcation: software-heavy funds face concentrated stress, while industrial, healthcare, and essential-services lenders actively compete for quality credits at improving terms. For institutional operators and investors navigating this environment, the critical question is not whether private credit is stressed, but which segment of the market you are in.
The macro backdrop shaping this dynamic is clear. SOFR stands at 3.87% as of October 19, 2026, down roughly 43 basis points from 4.24% a year ago on a 30-day average basis, yet still elevated by historical standards and now rising again following the Federal Reserve’s September 2026 rate increase. The Fed Funds target range moved to 3.75%–4.00% in September, reversing the easing trajectory that had supported borrower relief through mid-year. With the 2026 average 30-day SOFR at 3.65% versus 4.28% for 2025, the absolute cost of floating-rate debt remains historically high despite the cycle’s partial reversal.
Against this rate backdrop, new issue pricing for U.S. sponsor-backed middle market transactions widened by approximately 25 basis points through Q2 2026, reflecting volatility and a pullback in supply. The widening that began with the March 2026 dislocation, driven in part by AI disruption concerns across software portfolios, stabilized during Q3, with new issuance spreads remaining approximately 25–50 bps higher than year-end 2025 levels. Lenders who feared runaway spread compression at the start of the year have instead found a more constructive environment: fewer PIK requests, less aggressive leverage, more covenants, and stronger documentation are the early indicators of structural improvement that typically precede sustained spread widening.
The regulatory dimension compounds the picture. JP Morgan tightened advance rates to non-bank lenders in early March, particularly in relation to software exposure, a move that directly constrained fund-level leverage for software-focused BDCs and raised the effective cost of capital for that cohort. The Financial Stability Board’s May 2026 report flagged systemic concerns around leverage across the private credit ecosystem and liquidity mismatches in private credit funds, adding regulatory momentum to what is already a market-driven repricing of risk.
Quantitative Market Snapshot
The table below synthesizes current market data across the key metrics institutional operators and investors should be tracking entering Q4 2026.
| Metric | Current Value (Q3/Q4 2026) | Prior Period | Change | Source |
|---|---|---|---|---|
| SOFR (Overnight) | 3.87% (Oct 19, 2026) | 4.24% (Oct 2025, 30-day avg) | −37 bps YoY | NY Fed / sofrrate.com |
| Unitranche Coupon Spread (MM) | SOFR + 500–575 bps | SOFR + 475–550 bps (YE 2025) | +25 bps since YE 2025 | VRC Q3 2026 Pricing Matrix |
| Unitranche All-In Yield (unlevered) | High single digits (~9.4–9.9%) | ~8.9–9.4% (Q4 2025) | +~50 bps vs. YE 2025 | Northleaf Q2 2026 |
| HY Bond OAS (Broad Index) | 3.15–3.23% (Oct 8–15, 2026) | ~2.60% (Aug 28, 2026 trough) | +55–63 bps from trough | ICE BofA / FRED |
| Private Credit vs. HY Spread Premium | ~150–200 bps over public HY | ~350 bps (2019) | Compressed ~150–200 bps over 7 years | Owners.PE, Apr 2026 |
| Private Credit Default Rate (Proskauer PCDI) | 2.51% (Q2 2026) | 1.84% (Q3 2025) | +67 bps YoY | Proskauer, Jul 28, 2026 |
| Private Credit Default Rate (Fitch, incl. extensions) | 6.0% (Q2 2026, record) | Lower; 9.2% reported for all 2025 (different methodology) | Elevated; methodology-dependent | Fitch / Kaden Wood Capital, Aug 2026 |
| C&I Loan Standards (Large/MM Firms) | Net 0.0% tightening (Q3 2026) | Net 8.1% tightening (Q2 2026) | Standards stabilized, eased sequentially | Fed SLOOS / FRED, Aug 3, 2026 |
| MM Direct Lending Deal Volume (US Sponsored) | ~$46B (1H 2026) | ~$75B (1H 2025, implied) | Below long-term average; subdued | StepStone Group, Aug 2026 |
| Leverage Multiples (New Deals, High-Quality) | 5.0x–6.0x EBITDA | 6.5x–6.8x (2021–2022 vintages) | More conservative; ~1–2 turns lower vs. peak | VRC Proprietary Data, Jun 30, 2026 |
| KBRA Default Forecast (DLD Index) | 2.5% for 2026 | 2.0% (prior forecast) | Revised upward 50 bps | KBRA / Northleaf Q2 2026 |
All-in yields calculated using 30-day avg SOFR ~3.88% plus unitranche spread range. Sources as linked. Data as of dates indicated.
KPI Watchpoints: Leverage and Coverage
For underwriting discipline, two KPIs are drawing heightened lender scrutiny in the current cycle:
- Net Leverage: Loans originated in 2021–2022 carry median net leverage of approximately 6.5x–6.8x EBITDA, well above the 5.0x–6.0x range standard in current underwriting. This vintage gap is the single largest driver of portfolio stress today.
- Interest Coverage (FCCR Proxy): Early 2022 vintage borrowers saw interest expense increase approximately 40%, pushing average interest coverage from ~2.2x at origination down to the mid-1.5x range by Q3 2024. More recent vintages benefit from the partial SOFR decline, with coverage recovering toward the 2.0x historical threshold.
- Fund-Level D/E: Fund-level debt-to-equity has risen to 1.0x, which while still manageable, warrants monitoring, particularly if leverage trends toward 1.2x, where losses would be materially amplified in a stress scenario.
Sector Analysis: Where Lender Appetite Is Expanding, and Contracting
Healthcare: The New Anchor Sector
The most significant sectoral rotation of 2026 has been healthcare’s ascent to the top of the direct lending league table. Healthcare displaced Technology as the sector receiving the largest share of direct lending deployment in Q1 2026, according to PitchBook LCD data, accounting for 22% of direct lending issuance YTD through March, up from 18% in 2025. This is not a temporary dislocation; it reflects structural demand: demographic shifts and non-cyclical service models continue to attract lenders seeking stable cash flows. Healthcare was also, per Octus data, the only major industry to not see significant year-over-year price tightening in 2025, with spreads landing at an average of approximately SOFR+500 bps in Q4, suggesting disciplined pricing has been maintained even as capital competition intensified.
Software & SaaS: From Feast to Finger Food
The sharpest reversal in lender appetite belongs to software. Software companies accounted for just 12% of all PE-backed direct lending deals by count tracked by LCD so far in 2026, down from 16% in 2025, and represented only 15% of PE-backed direct lending volume, down from 22% last year and a peak of 27% in 2020–2022. The proximate cause: AI-induced concerns about software subscription economics, specifically the fear that bespoke AI tools would commoditize SaaS platforms, drove a fundamental repricing in Q1 2026. SaaS and software exposure had grown to approximately 19% of total direct private credit loans by end-2025, with one-third of all private credit funds holding sector exposure, creating concentrated redemption pressure. Software and technology credits continue to price 50–100 bps wider than broader market levels, and financing, where available, now requires lower leverage, higher pricing, or a compelling AI-beneficiary narrative.
Industrials, Infrastructure & Physical Economy: The Relative Value Play
The rotation out of software has reinforced the relative attractiveness of what Man Group analysts describe as “hard asset, low obsolescence” businesses: healthcare services, industrials, business services, food and beverage, distribution, and infrastructure-adjacent sectors. Private credit lenders specializing in industrial and manufacturing borrowers are expanding market share, with competition among these funds pushing spreads lower on quality credits. S&P Global’s April 2026 cross-industry analysis confirmed this divergence, with manufacturing, infrastructure, and essential-services credits attracting active lender competition even as software credits see pullback.
Lower Middle Market: A Structural Outlier
The lower middle market ($5M–$25M EBITDA) represents a notable structural exception to the spread compression narrative that defined the broader market through 2025. LMM spread premiums widened to 232 bps over large-cap in Q3 2025, even as upper-market spreads hit record compression. The barriers to entry (longer diligence, smaller deal sizes, and higher execution complexity) have insulated the segment. Relative to the more crowded core and upper middle, the LMM offers higher relative spreads, more conservative leverage, stronger covenant packages and greater lender influence over transaction structure.
Implications for Institutional Investors and Business Operators
What This Means for Borrowers
The most important operational signal for middle-market borrowers in Q4 2026 is that lender selectivity is no longer correlated with credit quality alone; it is now fund-specific. North American private credit dry powder exceeds $280B, but availability depends entirely on which fund you are working with. Borrowers in software, technology, or AI-adjacent verticals face structural headwinds regardless of individual company performance: fund-level stress (redemption caps, workout bandwidth, deployment slowdowns) is now a deal execution variable for performing borrowers. Borrowers with stronger coverage ratios (FCCR ideally above 2.0x), net leverage below 5.5x, and defensible physical-economy business models are finding a competitive lender market. For those approaching maturities with 2021–2022 vintage debt, elevated leverage and approaching maturities have driven increased restructuring activity, including LMEs and defaults, proactive dialogue with lenders is essential, not optional.
On the bank lending side, the July 2026 Fed SLOOS provides an important tailwind: the net percentage of domestic banks tightening C&I standards for large and middle-market firms fell to 0.0% in Q3 2026, down from 8.1% in Q2 and 9.5% a year ago. This means bank competition for quality credits is re-intensifying, which should exert modest downward pressure on private credit spreads for the most coveted borrowers, but does not mitigate the fundamental restructuring challenge facing stressed vintages.
What This Means for Lenders and Investors
For institutional allocators, the critical insight from the current cycle is that the illiquidity premium that justified private credit allocations has compressed materially. In 2019, private credit offered ~350 bps of spread over public high yield for comparable risk; today, that spread has compressed to ~150–200 bps. With the ICE BofA HY OAS at 3.23% as of October 15, 2026, and an HY effective yield of approximately 8.1%, the relative value calculus is tighter than it has been in years. The direct lending trailing 12-month total return declined to 8.1% in March 2026, while income returns only slightly decreased to 9.9%, suggesting that income generation remains a core pillar of the thesis even as capital appreciation moderates. The evergreen vehicle redemption wave, BDC subscriptions fell from $8.7B in Q4 2025 to $3.6B in Q2 2026, while redemptions rose to $8.4B and $6.4B respectively, is a structural liquidity risk that allocators must price into their vehicle selection.
Crucially, the default rate debate matters enormously for portfolio construction. Proskauer’s payment-only methodology prints 2.51% for Q2 2026, while Fitch’s full rating-agency definition (including distressed exchanges and maturity extensions) prints 6.0% for the same period, a record. Allocators using the lower number to underwrite loss expectations may be materially understating portfolio risk if their holdings include a significant share of maturity extensions and PIK conversions that have not yet triggered traditional default events.
Forward-Looking View: Next 3–6 Months
The Federal Reserve remaining on hold with a bias toward tightening, combined with wider spreads, stable borrower fundamentals, and growing financing demand, makes forward return potential more attractive today than at the start of the year. However, the convergence of a $12.7B BDC maturity wall, continued retail redemption pressure through 2027 (Goldman Sachs expects evergreen retail funds to remain in net outflows throughout 2026 and likely 2027), and the 2021–2022 vintage maturity wave creates a challenging deployment environment for the next two to three quarters. The most durable advantage for investors may come from better documentation, more conservative leverage, and the time to conduct stress analysis before capital is deployed, a description that favors patient, selective managers over those pressured by capital deployment pace.
Key Market Insights: Five Actionable Takeaways
- Spreads have stabilized, not compressed. Unitranche spreads held at SOFR+500–575 bps in Q3 2026, approximately 25–50 bps above year-end 2025 levels, the floor appears to have been set. With SOFR at 3.87–3.89% following the September Fed hike, the all-in yield environment remains attractive for disciplined lenders in the 9%+ range.
- Software is structurally impaired as a lending category, for now. Market sources indicate private credit software deals in 2026 have typically been refinancings and extensions completed by incumbent lenders, as it is tough to attract new lenders to legacy software credits. Operators and investors with concentrated software exposure must stress-test under Fitch’s 6.0% default framework, not just Proskauer’s 2.51% payment-default rate.
- Healthcare and industrials are the structural beneficiaries. Healthcare’s rise to 22% of direct lending issuance in Q1 2026, displacing technology, and industrial lenders’ expansion of market share signal a durable, not temporary, rotation. Borrowers in these sectors have pricing leverage and access to competitive capital.
- The vintage gap is the credit cycle’s most urgent risk. 2021–2022 vintage loans carry median net leverage of 6.5x–6.8x and estimated interest coverage of 1.7x–1.8x, below the 2.0x FCCR threshold most lenders require and well above the leverage levels permissible in today’s underwriting. Maturities in this cohort, combined with a $12.7B BDC maturity wall, define the dominant credit event risk for H1 2027.
- Bank standard stabilization is a double-edged signal. The SLOOS net tightening rate for C&I standards returning to 0.0% in Q3 2026 signals banks re-entering competition for quality credits, which is positive for borrowers and moderately negative for private credit spread premiums on the best deals. For operators, this is a window to refinance or reprice high-cost private credit with bank facilities where FCCR, leverage, and sector exposure permit.


