
Why the Gap Between a Loan and an Asset’s Value Is Everything
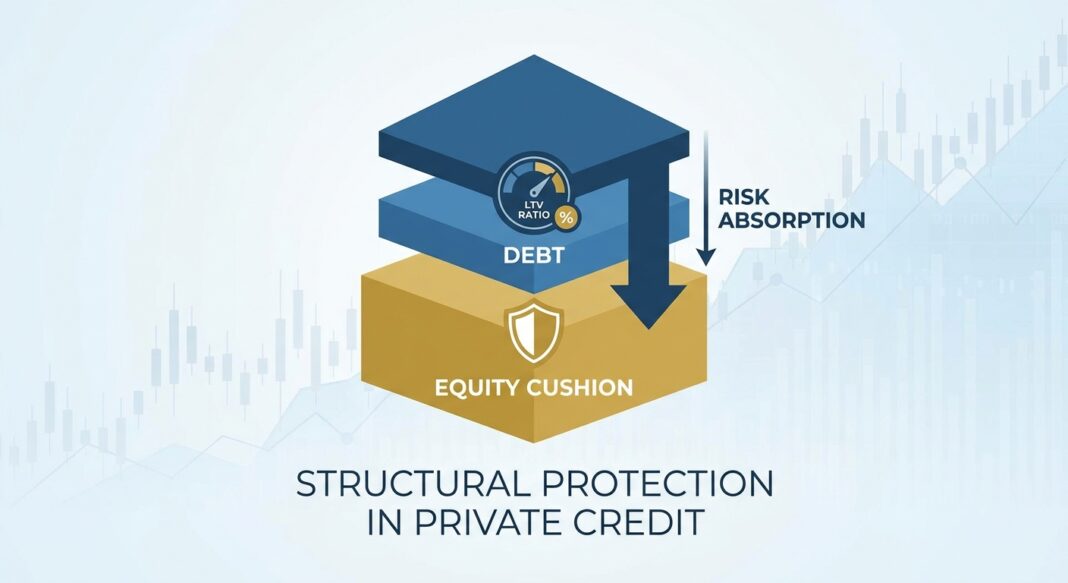
When a private credit lender writes a check to fund an acquisition or refinancing, they are not simply betting on a borrower’s ability to repay. They are engineering a structural buffer, a layer of equity capital sitting beneath their loan that must be wiped out entirely before the lender loses a single dollar of principal. That buffer is the equity cushion, and the ratio that measures it, the Loan-to-Value (LTV): is arguably the single most important metric in private credit underwriting.
Understanding how equity cushions are built, measured, and stress-tested is foundational knowledge for anyone evaluating private credit as an investor, or seeking private credit as a business owner. In today’s market (where banks are tightening standards and private credit has crossed $2 trillion in assets under management) this mechanism has never been more consequential.
The Concept: What Is an Equity Cushion?
Every leveraged capital structure stacks different classes of capital in a specific priority waterfall. At the top sits senior secured debt, typically a first-lien loan originated by a private credit fund. Beneath it may sit mezzanine debt or subordinated notes. At the very bottom sits equity, contributed by the private equity sponsor or owner-operator at closing.
The equity cushion is the dollar value of that bottom layer expressed as a percentage of total enterprise value. If a business is worth $100 million and the owner has put in $50 million of equity, the first-lien lender who provides $50 million of debt holds an LTV of 50%. That means the business’s value would need to fall by more than half before the lender starts to absorb losses.
LTV Formula: LTV = Total Debt ÷ Enterprise Value. The equity cushion is simply the inverse: Equity Cushion % = 1 − LTV.
A lower LTV signals greater lender protection. A lender holding a 40% LTV loan has a 60% equity cushion, the enterprise value would have to collapse by 60% before principal is at risk. Conversely, a lender at 80% LTV has a thin 20% cushion and far less room for error.
How It Works: A Concrete Example
Consider a mid-market manufacturing company with $10 million in annual EBITDA. A private equity firm acquires it at a 7x EBITDA multiple, a $70 million enterprise value. The deal is structured as follows:
- Senior First-Lien Loan (Private Credit Fund): $35 million
- Mezzanine Debt: $7 million
- Equity (PE Sponsor): $28 million
- Total: $70 million enterprise value
The first-lien lender’s LTV is $35M ÷ $70M = 50%. Their equity cushion is 50%, meaning the business would need to lose half its value before the senior lender faces any principal impairment. The mezzanine lender’s LTV calculates to ($35M + $7M) ÷ $70M = 60%, with a 40% cushion. The equity investor, absorbing all residual risk, effectively holds 100% LTV from a loss-absorption perspective.
Now stress-test it: EBITDA falls 30% due to a customer loss, compressing the enterprise value from $70M to $49M (at the same 7x multiple). The first-lien lender’s LTV rises to $35M ÷ $49M = 71%: still protected. The mezzanine lender is at $42M ÷ $49M = 86%: under pressure. The equity investor has seen their $28M stake lose most of its value. This is how the capital stack is designed to work: equity absorbs first, protecting debt holders above it.
Current Market Relevance
Equity cushion discipline is not just theoretical; it is measurable, and current data shows it is holding up well even as the credit cycle matures.
According to Partners Group (May 2026), average equity contributions at origination in leveraged buyouts have risen steadily over the past decade, climbing from approximately 35% in 2013 to around 50% today. That means the typical LBO entering the private credit market now carries a 50% equity cushion at closing, a meaningfully stronger starting position than a decade ago.
Complementing this, Heron Finance’s Q2 2026 Private Credit Benchmark Report found that loan-to-value ratios have remained stable across segments, noting that “such low LTVs allow for a significant first-loss capital cushion should the credit markets deteriorate.” The report also confirmed that approximately 90% of private credit loan assets are first-lien: the most structurally protected position in the stack.
On the loss side, data from the Cliffwater Direct Lending Index (CDLI-S), cited in Angel Investors Network’s May 2026 analysis, shows the senior direct lending index posted an annualized loss rate of just 0.29% from September 2010 through September 2025, compared to 1.49% for high-yield bonds over the same period. That outperformance is structurally explained by LTV discipline and first-lien positioning.
The broader institutional conviction in these structures remains firm: McKinsey’s January 2026 LP Survey found that 40% of limited partners plan to increase private credit allocations over the next 12 months, with respondents specifically citing the asset class’s “senior position in the capital structure” and “predictable income profile” as key drivers.
Meanwhile, the bank lending environment continues to create structural demand for private credit solutions. The Federal Reserve’s April 2026 SLOOS reported that survey respondents indicated, on balance, tighter lending standards for C&I loans to firms of all sizes during Q1 2026, reinforcing the structural gap that private credit lenders continue to fill, particularly for middle-market borrowers who cannot access public debt markets.
| Metric | Reading | Source |
|---|---|---|
| Avg. LBO Equity Contribution at Origination (2026) | ~50% | Partners Group, May 2026 |
| Share of Private Credit Loans that are First-Lien | ~90% | Heron Finance, Q2 2026 |
| CDLI-S Annualized Loss Rate (2010–2025) | 0.29% | Cliffwater via Angel Investors Network, May 2026 |
| Sub-1.0x Interest Coverage Borrowers (Q4 2025) | 14% (down from 21–23% in 2023) | Partners Group, May 2026 |
| LPs Planning to Increase Private Credit Allocations | 40% | McKinsey LP Survey, January 2026 |
Decision Framework
For Investors Evaluating Private Credit Funds
When assessing a private credit manager’s track record and current portfolio, equity cushion discipline is one of the most revealing indicators of underwriting quality. Investors may consider examining:
- Weighted Average LTV at Origination: Portfolios consistently originated below 50% LTV tend to carry materially lower loss severity in stress scenarios.
- First-Lien Concentration: Funds with 85–95% first-lien allocations structurally benefit from priority in both interest payments and recovery proceeds.
- LTV Drift Over Time: If enterprise values compress while debt balances remain fixed, LTVs rise. Monitoring current LTV versus at-origination LTV reveals whether equity cushions are eroding.
- Vintage Equity Contribution Trends: Loans originated when equity sponsors contributed only 30–35% of deal value (pre-2018) carry structurally thinner cushions than today’s 50% standard.
For Operators and Owners Seeking Capital
Business owners approaching private credit lenders should understand that the equity they retain or contribute in a deal directly determines the terms they receive. Lenders price risk based on the cushion beneath their loan. Practical considerations include:
- Higher equity contribution = lower cost of debt. A borrower willing to put 45–50% equity into a deal will often receive meaningfully better pricing than one at 30%.
- LTV tests are covenant triggers. Many private credit agreements include maintenance covenants tied to LTV or enterprise value. Understanding how these are calculated (and what headroom exists) is critical to avoiding technical default.
- Asset quality drives LTV credibility. Lenders stress-test enterprise values using conservative EBITDA multiples. Businesses with highly recurring, contracted revenue streams typically receive more credit (i.e., lower LTV requirements) for the same earnings level.
Key Takeaways
- The equity cushion is the lender’s primary structural protection: It must be exhausted before a senior lender faces principal loss, making it the foundational concept in private credit risk management.
- LTV discipline is measurable and improving: Average equity contributions at LBO origination have grown from ~35% in 2013 to ~50% today, according to Partners Group data, providing meaningfully thicker buffers than prior cycles.
- First-lien positioning amplifies cushion value: Approximately 90% of private credit loans are first-lien, ensuring priority in both income and recovery, a key driver of the CDLI-S’s 0.29% annualized loss rate over 15 years.
- Bank retrenchment structurally expands private credit’s role: With the Federal Reserve’s April 2026 SLOOS confirming continued tightening of C&I lending standards, private credit lenders can increasingly enforce conservative LTV terms without losing deal flow to bank competitors.
- For operators, equity is not just cost, it’s protection: The equity a business owner contributes to a deal structure is not simply dilutive; it creates the cushion that secures more favorable debt pricing, covenant flexibility, and lender confidence through economic cycles.


