
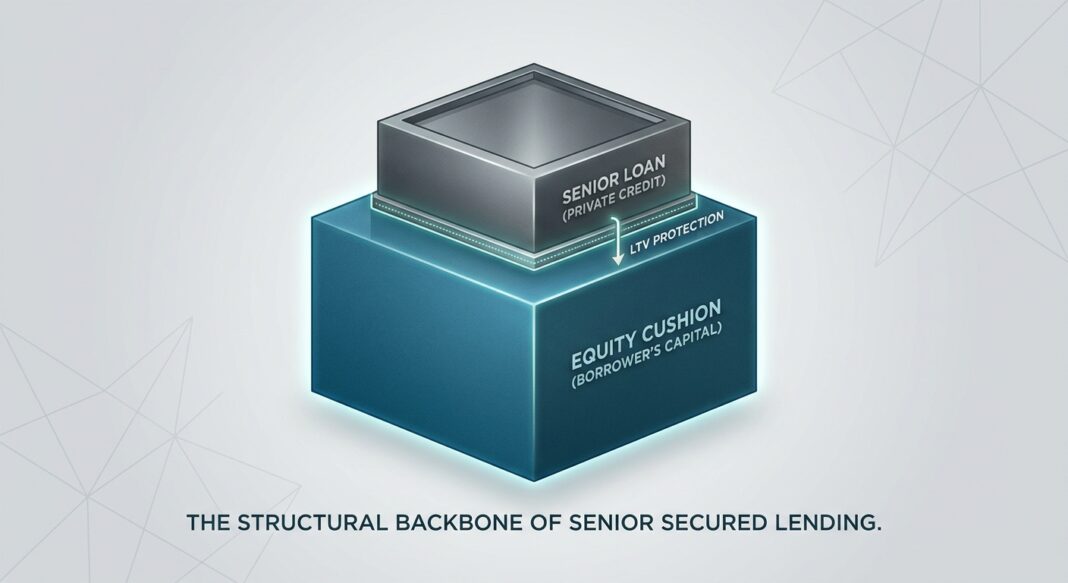
Why the Borrower's Skin in the Game Is the Lender's First Line of Defense
In private credit, not all loans are created equal. The difference between a loan that weathers a downturn and one that results in impairment often comes down to a single, fundamental question: how much equity does the borrower have beneath the debt? This concept, the equity cushion: is measured by the loan-to-value (LTV) ratio, and it sits at the heart of how disciplined direct lenders evaluate and protect capital.
As bank lending standards have tightened across multiple consecutive Federal Reserve survey cycles, middle-market borrowers have increasingly turned to private credit for their financing needs. Understanding what LTV means (and why its current levels matter) is essential knowledge for both investors evaluating private credit allocations and business owners exploring their capital options.
What Is Loan-to-Value, and How Does It Protect a Lender?
The loan-to-value ratio expresses the size of a loan as a percentage of the total value of the asset or company being financed. In corporate direct lending, that value is the borrower's enterprise value (EV): a measure roughly equivalent to what a buyer would pay for the entire business, including all debt and equity.
According to Ares Management, in direct lending, LTV refers to the amount of debt a private equity sponsor has borrowed relative to the total enterprise value of the portfolio company. A lower LTV indicates less leverage and a less risky loan, analogous to a homebuyer who puts down a larger down payment being considered a safer borrower.
The formula is straightforward:
LTV = Loan Amount ÷ Enterprise Value × 100
If a private equity sponsor acquires a company with a $100 million enterprise value and puts in $55 million of equity, financing the remaining $45 million with a senior secured loan, the LTV is 45%. That means enterprise value would have to fall by more than 55% before the lender's principal is even theoretically at risk, a meaningful buffer in most economic environments.
Critically, the equity sitting beneath the debt is not passive. Private equity sponsors have a powerful incentive to protect that equity by supporting portfolio companies through stress, injecting additional capital when needed, or negotiating amendments to give the business time to recover. This dynamic is a structural feature of sponsor-backed lending that distinguishes it from many other credit markets.
A Concrete Example: The $100M Company
Consider a mid-sized software company with $20 million in annual EBITDA. A private equity sponsor acquires it at a 5x EBITDA multiple, implying an enterprise value of $100 million. The transaction is financed as follows:
- Senior Secured Loan (Private Credit): $45 million, LTV of 45%, Deal Leverage of 2.25x EBITDA
- Private Equity Equity: $55 million, the equity cushion absorbing first losses
Now apply a stress scenario: a combination of margin compression and multiple contraction causes enterprise value to fall 35%, from $100 million to $65 million. The equity cushion has been materially eroded, but the $45 million senior loan remains fully covered. It would take a 55% collapse in enterprise value before the senior lender faces impairment.
According to Ares Management, when evaluating direct lending funds, investors consider LTV alongside deal leverage (debt as a multiple of EBITDA) and the interest coverage ratio (EBITDA divided by annual interest payments). In the example above, at a 10% all-in rate, annual interest would be $4.5 million, and with $20 million of EBITDA the interest coverage ratio stands at 4.4x, indicating meaningful capacity to service debt even if earnings deteriorate.
This layered framework (LTV for collateral protection, deal leverage for structural context, and interest coverage for cash-flow adequacy) gives lenders and investors a three-dimensional view of credit risk that a single metric cannot provide.
Current Market Reality: Where LTVs Stand Today
The good news for senior secured lenders is that equity cushions in today's direct lending market remain historically meaningful, even as deal volumes recover and competition among lenders increases.
According to a Morgan Stanley Investment Management (February 2026) Q&A with their North American Private Credit team, loan-to-value ratios across their core middle market exposure “generally remain in the 40% range,” providing meaningful insulation for senior secured lenders, even as base rates declined and some spread compression occurred over 2024 and 2025.
For sponsor-backed software companies specifically, one of the most-scrutinized sectors in 2025-2026 due to AI disruption concerns, Morgan Stanley notes that a typical loan carries 25–40% LTV, meaning material impairments would require a near-complete elimination of the private equity capital stack, an outcome sponsors have strong financial incentives to prevent.
Independently, data from Cliffwater's Corporate Lending Fund (CCLFX), reported by Larry Swedroe (April 2026), shows an average LTV of just 41% across more than 4,000 unique credits and over $32 billion in AUM as of February 2026, consistent with the broader institutional market.
Zooming out, LPL Research (March 2026) corroborates this picture, noting that private credit loans commonly feature LTVs in the 40–60% range, with private equity sponsors contributing substantial equity, often 40–60% or more of deal value. This creates a buffer that must be significantly eroded before senior debt faces material impairment.
On the macro backdrop, the Federal Reserve's April 2026 SLOOS reported that modest net shares of banks continued to tighten standards on C&I loans to firms of all sizes during Q1 2026, citing a less favorable economic outlook and reduced risk tolerance as key reasons. This sustained bank retrenchment continues to redirect credit-worthy middle-market borrowers toward private lenders, where structurally conservative LTVs remain the norm.
| Metric | Data Point | Source |
|---|---|---|
| Average LTV, core middle market direct lending | ~40% | Morgan Stanley IM, Feb 2026 |
| Average LTV, Cliffwater CCLFX (4,000+ credits) | 41% | Cliffwater / Swedroe, Apr 2026 |
| Typical LTV range, private credit loans (broadly) | 40%–60% | LPL Research, Mar 2026 |
| Banks tightening C&I lending standards, Q1 2026 | Modest net share, all firm sizes | Federal Reserve SLOOS, Apr 2026 |
| Global private credit AUM (estimate) | ~$3.2 trillion | PIMCO, Jun 2026 |
| Projected first lien loan yields, 2026 | 8.0%–8.5% | Morgan Stanley IM, 2026 Outlook |
Decision Framework: What This Means for Investors and Operators
For Investors Evaluating Private Credit Funds
LTV is one of the most important (and most underutilized) due diligence metrics when comparing direct lending funds. Investors may consider the following framework:
- Request weighted-average LTV at the portfolio level. A fund reporting average LTVs consistently in the 40–50% range is structurally positioned to absorb significant value impairment before principal is at risk. Funds with LTVs above 60% warrant deeper scrutiny of sector mix, sponsor quality, and covenant protections.
- Evaluate LTV alongside deal leverage and interest coverage. According to Ares Management, these three metrics collectively describe the multi-dimensional risk profile of any direct lending portfolio. LTV alone does not capture cash-flow adequacy; coverage ratios tell that part of the story.
- Assess sponsor quality. LTV protection is only as strong as the sponsor's willingness to defend their equity. Established private equity sponsors with large invested positions and reputational incentives provide an additional, non-quantitative layer of protection that institutional lenders factor heavily into underwriting.
- Distinguish between asset classes. LTV ratios in real estate direct lending (often 60–75% for stabilized properties, per Titan Funding, Feb 2026) differ structurally from corporate direct lending, where enterprise value, rather than hard asset value, forms the collateral base.
For Operators and Business Owners Seeking Capital
Understanding how lenders think about LTV directly informs how business owners can structure their capital raise to achieve better terms:
- Higher equity contributions lower borrowing cost. A business owner who brings more equity to the table, reducing LTV, signals commitment and reduces perceived lender risk, which can translate into tighter spreads, more flexible covenants, or larger loan amounts. According to Ares Management, similar to the way a homebuyer with a larger down payment is considered a less risky borrower, a company owner investing more equity is generally seen as a safer credit.
- Private credit fills the gap banks have vacated. The Federal Reserve's April 2026 SLOOS confirmed that banks continued tightening C&I lending standards in Q1 2026, particularly citing economic uncertainty and reduced risk tolerance. Middle-market companies, especially those generating $15–$200 million in EBITDA, may find private credit lenders more accessible and structurally flexible than their banking counterparts.
- Know your enterprise value narrative. Because private credit LTV is denominated against enterprise value (not hard assets), operators benefit from presenting a clear, defensible valuation case (supported by comparable transactions, revenue quality, and earnings durability) when approaching direct lenders.
Key Takeaways
- LTV measures the equity buffer beneath a loan. In corporate direct lending, it compares the loan amount to the borrower's enterprise value. Lower LTV means more equity protecting the lender's capital.
- Industry LTVs remain conservative. Institutional direct lenders are reporting weighted-average LTVs in the 40–41% range as of early 2026, consistent across multiple credible data sources including Morgan Stanley IM and Cliffwater's index.
- The equity cushion is active, not passive. Sponsor-backed borrowers give lenders a powerful structural ally, private equity sponsors with large equity stakes have strong incentives to support portfolio companies rather than let loans go into default.
- LTV must be evaluated alongside leverage multiples and interest coverage. No single metric tells the full story. Disciplined lenders and sophisticated investors use all three to assess risk holistically.
- The bank retrenchment trend is structural, not cyclical. Continuous tightening in bank C&I standards, documented across every 2025–2026 SLOOS release, continues to redirect middle-market borrowers toward private credit, where conservative LTV underwriting standards have become a defining structural characteristic of the asset class.


