
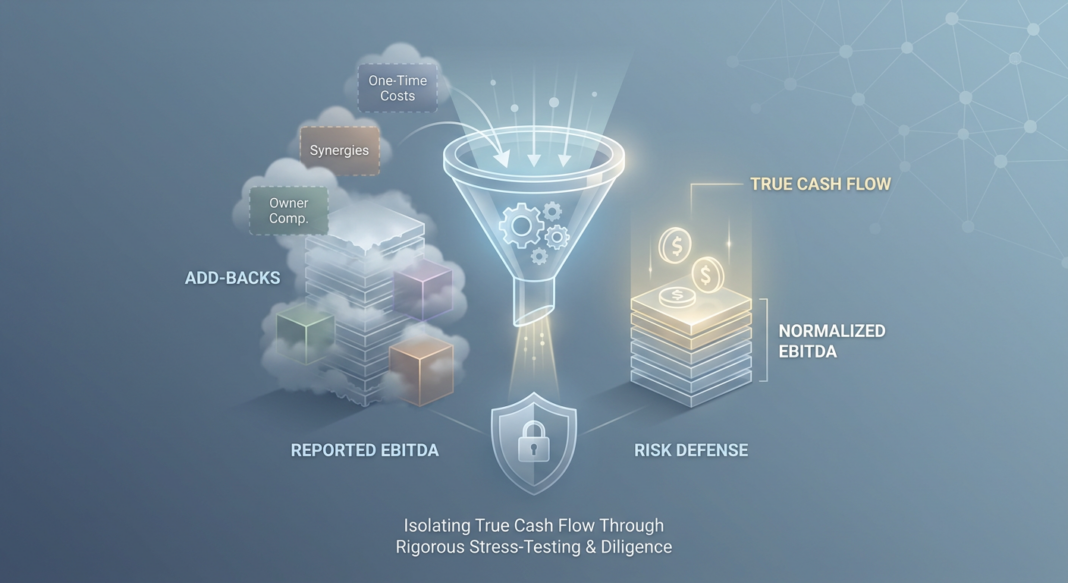
The Underwriting Question That Determines Everything
A manufacturing company presents its lender with $10.2 million in reported EBITDA and a proposed first-lien term loan of $45 million, a 4.4x leverage multiple that sits neatly within institutional guidelines. The CIM is polished. The management team is credible. The sponsor is well-known. And yet, buried in the footnotes of the company’s three-year P&L is a pattern that experienced underwriters recognize immediately: a series of “one-time” charges that have appeared, in varying form, every single year for 36 months.
This is the EBITDA normalization problem, and it sits at the center of every leveraged credit decision. The seller’s Adjusted EBITDA is a starting point, not a conclusion. The lender’s job is to determine the version of EBITDA that is sustainable, financeable, and defensible under stress. Getting this wrong doesn’t just affect pricing. It determines whether the loan gets repaid at all.
In today’s credit environment, this discipline has become more consequential than ever. Lenders are tightening underwriting standards as LP scrutiny increases and buyers demand greater transparency on how EBITDA converts to free cash flow. The bridge between reported and adjusted EBITDA is no longer a negotiating footnote; it is a primary risk signal that diligence teams must resolve before committing capital.
The Analytical Framework: A Four-Layer EBITDA Bridge
Experienced credit underwriters do not accept a single EBITDA figure. They build a structured bridge that reconciles reported earnings through four analytical layers, each with a distinct purpose and risk profile.
Layer 1: Reported EBITDA
This is the starting point: earnings before interest, taxes, depreciation, and amortization as shown in the company’s financial statements. It reflects GAAP accounting choices, owner compensation decisions, and all historical operating costs. In private-company M&A, reported EBITDA is almost never the underwriting number. Buyers and advisors almost always analyze whether the company’s earnings need to be adjusted to reflect how the business actually operates on a normalized basis.
Layer 2: Adjusted EBITDA (Seller’s View)
This is the management team’s add-back schedule: a presentation of what the business “could earn” after removing non-recurring costs, owner-specific expenses, and items that won’t continue under new ownership. Adjusted EBITDA can include normalization adjustments as well as broader deal-specific or pro forma considerations, and its meaning shifts depending on whether it is presented by a sponsor, a banker, or a diligence provider.
Underwriter’s note: Sellers add back expenses to increase EBITDA. Buyers sometimes make downward adjustments to remove one-time revenue or non-recurring income that inflated the seller’s trailing results. The negotiation runs in both directions.
Layer 3: Normalized EBITDA (Lender’s View)
This is the underwriter’s own analysis, an independent estimate of sustainable, recurring operating earnings after applying conservative scrutiny to every add-back. Normalized EBITDA is the sustainable earnings base buyers and lenders try to underwrite, not simply the seller’s highest adjusted EBITDA presentation. Adjusted EBITDA usually starts with management’s add-backs, while normalized EBITDA reflects the adjustments that survive diligence and support a repeatable run-rate.
Lenders are cautious by design. They will only consider adjustments that can be clearly justified and traced back to the company’s financial statements, and they often use the most conservative EBITDA definition because it drives debt sizing, covenants, and repayment capacity.
Layer 4: Stress-Case EBITDA
This is the downside scenario: normalized EBITDA haircut for cyclical deterioration, customer attrition, cost inflation, or a macro shock. No underwriter should size a loan exclusively to the base case. The stress-case EBITDA drives covenant headroom calculations, recovery analysis, and true debt capacity.
🔹 Worked Example: $10M EBITDA Manufacturing Company
| EBITDA Layer | Amount ($M) | Underwriter Action |
|---|---|---|
| Reported EBITDA | $7.8M | Starting point from audited financials |
| + Seller Add-Backs | +$2.4M | Owner compensation above market rate, one-time legal settlement, discontinued product line costs |
| = Seller’s Adjusted EBITDA | $10.2M | Headline number presented in CIM |
| − Lender Reversals | −$1.1M | “One-time” IT cost appearing 3 years running ($0.4M); recurring litigation reserve ($0.4M); unsupported synergy assumption ($0.3M) |
| = Normalized EBITDA (Lender) | $9.1M | Basis for debt sizing and covenant calibration |
| = Stress-Case EBITDA (−20%) | $7.3M | Tests covenant headroom and debt service under cyclical downturn |
At $45M debt / $9.1M normalized EBITDA, leverage is 4.9x, meaningfully above the 4.4x the seller’s CIM implied. At stress-case EBITDA of $7.3M, leverage rises to 6.2x, well above typical first-lien maximum thresholds. The loan sizing must be revisited.
The Analysis: Walking Through the Add-Back Challenge Process
A Quality of Earnings analysis is the formal diligence process that tests the EBITDA bridge. A QoE review commonly evaluates revenue recognition, customer concentration, revenue quality, gross margin trends, add-back support, reserves, accounting cutoffs, working-capital behavior, cash conversion, and the relationship between EBITDA and cash flow. The purpose is not merely to verify arithmetic. It is to determine whether the earnings base used in valuation is accurate, repeatable, and financeable.
The Five Categories of Add-Back Scrutiny
- Recurrence Test: Is this cost genuinely non-recurring? If an “exceptional” cost appears every year, it is no longer exceptional. Underwriters should require three years of historical P&Ls and stress-test whether similar charges have appeared in prior periods.
- Owner Compensation Normalization: If the seller pays themselves significantly above a market replacement wage, the excess may be added back. Conversely, if the seller underpays themselves, lenders may reduce EBITDA to reflect a realistic market salary for a professional manager. This adjustment runs in both directions and requires benchmarked compensation data.
- Related-Party Transaction Review: Rent paid to a seller-owned entity, management fees paid to a sponsor, or intercompany services priced off-market all distort operating EBITDA and must be adjusted to arm’s-length market terms.
- Revenue Quality Test: Buyers challenge EBITDA add-backs through the QoE review by examining whether revenue is truly recurring and whether any pull-forward, channel stuffing, or aggressive recognition policies inflated the trailing twelve months. Revenue pulled forward (where strong quarters are driven by early invoicing or accelerated deal timing) can be GAAP-compliant and still be a warning sign for repeatability.
- Cash Conversion Bridge: EBITDA is not cash. The underwriter must reconcile EBITDA to free cash flow by deducting cash taxes, mandatory debt service, maintenance capex, and working capital requirements. If EBITDA is rising but the company is not generating more operating cash, that is a signal that improved earnings may be on paper only, from accounting changes or timing differences rather than real growth.
Key Metrics and Calculations
- Total Leverage: Total Debt ÷ Normalized EBITDA. Institutional first-lien thresholds typically range from 4.0x–5.5x depending on sector and structure.
- Debt Service Coverage Ratio (DSCR): (Normalized EBITDA − Cash Taxes − Maintenance Capex) ÷ (Annual Interest + Mandatory Amortization). A DSCR below 1.25x at normalized case should trigger re-sizing or structural mitigation.
- Free Cash Flow Conversion: Free Cash Flow ÷ EBITDA. Below 60% conversion signals capex intensity, working capital drag, or a cash tax burden that undermines debt service capacity.
- EBITDA-to-Revenue Margin Trend: Compare LTM margins to three-year averages. Sudden margin expansion in the trailing period that cannot be operationally explained is a red flag for either unsustainable cost cutting or add-back inflation.
Institutional Standards: What the Credit Data Tells Us
The cost of underwriting EBITDA incorrectly is not theoretical. The leveraged loan market is producing documented evidence of what happens when normalized earnings prove insufficient to service debt in a higher-rate environment.
📊 Credit Performance Data Box (2024–2026)
- Leveraged loan default rate: Climbed to a decade-high of 5.6% by late 2024, driven largely by distressed exchanges, surpassing the 4.5% COVID-era peak in 2020. (Source: FTI Consulting / LSEG LPC, 2025 Leveraged Loan Market Survey)
- Moody’s forecast: The leveraged loan default rate is projected to end 2025 at 7.5% and peak at 7.9% in Q1 2026, more than double the 3.4% historical average. (Source: Moody’s Asset Management Research, July 2025)
- Distressed exchanges as share of defaults: Distressed exchanges accounted for 64% of all defaults in the first half of 2025, approximately the same pace as all of 2024, which was itself the highest annual share on record. (Source: Moody’s Ratings, July 2025)
- Recovery rate impact: According to Fitch, in 2024, companies that defaulted and previously engaged in an LME had lower recovery rates for first-lien debt by approximately 57% relative to issuers who did not conduct an LME. (Source: Fitch Ratings, cited by WTW, October 2025)
- Repeat default risk: S&P notes that 33% of issuers filed for bankruptcy post-LME and 56% either re-defaulted or are currently rated CCC+ or below, with only 10% repaying in full or maintaining ratings of B− or better without re-defaulting. (Source: S&P Global, cited by Wellington Management, March 2025)
- Sector concentration: Approximately 30% of distressed restructurings in 2024 came from three sectors: healthcare/pharmaceuticals, business services, and high-tech industries. (Source: Moody’s Ratings, Leveraged Finance Interest, January 2025)
What Institutional Lenders Look For
The data above reinforces a structural reality that experienced underwriters now navigate daily: the explosion of liability management exercises (LMEs) has fundamentally changed the recovery calculus for leveraged lenders. LMEs have emerged as an alternative for highly leveraged companies to avoid or delay costly courtroom defaults, to restructure existing debt, or to raise additional liquidity. For companies backed by private equity, LMEs may be a means to protect or improve equity holder positions at the expense of debtholders.
More than 90% of the Morningstar/LSTA Loan Index was classified as “covenant-lite” in 2024, a structural shift that has required lenders to revisit their recovery assumptions and incorporate greater dispersion in their downside analysis. In this environment, rigorous EBITDA normalization at underwriting is not just a valuation exercise. It is a first line of defense against acquiring exposure to a borrower whose true free cash flow cannot support its debt load under any reasonable stress scenario.
The Most Common Red Flags in Lender EBITDA Review
- Stacking of marginal add-backs: Each individual adjustment appears reasonable, but the cumulative effect of 8–12 add-backs inflates EBITDA by 30–40% above reported earnings. The aggregate adjustment percentage should always be calculated and benchmarked.
- Synergy and cost-save add-backs without execution history: For complex pro forma adjustments, experienced lenders expect not only robust supporting evidence but also a demonstrated history of successfully executing similar cost-reduction or operational improvement initiatives.
- EBITDA-cash flow divergence: Rising EBITDA accompanied by deteriorating operating cash flow is one of the most reliable early warning indicators in credit analysis. If the numbers don’t match up, that is a sign that something may be off.
- Customer concentration obscured by structure: Revenue may appear diversified, but multiple “customers” may be one channel partner, one platform, or one end-client operating behind multiple entities, leaving true concentration risk undetected without entity-level revenue analysis.
- Margin expansion from deferred investment: Margins spike because the company paused hiring, cut marketing, delayed maintenance, or underinvested in support infrastructure. EBITDA looks strong, but the business cannot sustain those margins without paying the deferred cost later.
Underwriting Checklist: EBITDA Normalization Diligence
The following framework reflects institutional credit underwriting practice for middle-market leveraged transactions. Each item should be documented in the credit memo before final approval.
✅ Step 1: Obtain and Analyze Three Years of Financials
- Request audited or reviewed financial statements for three full fiscal years plus the trailing twelve months (TTM)
- Require monthly management accounts for the TTM period to identify seasonal patterns and period-end anomalies
- Compare revenue recognition policies across periods; flag any changes in accounting methodology
✅ Step 2: Build the Lender’s EBITDA Bridge
- Start from audited EBITDA; list every seller add-back individually with dollar amount and supporting documentation
- Apply the recurrence test: any “non-recurring” item that appears in two or more of the prior three years must be reclassified as recurring
- Apply market-rate replacement for owner compensation; document the compensation benchmark source
- Adjust all related-party transactions (rent, management fees, intercompany services) to arm’s-length market rates
- Reverse all pro forma synergy add-backs that lack documented execution history
✅ Step 3: Validate Revenue Quality
- Analyze customer concentration: identify top-10 customers by revenue and assess contract terms, renewal history, and switching costs
- Test for revenue pull-forward: compare invoice date to contract performance date; identify any period-end acceleration
- Assess recurring vs. non-recurring revenue split; require a contract-by-contract schedule for subscription or retainer-based revenue
✅ Step 4: Build the Free Cash Flow Bridge
- Deduct maintenance capex (not growth capex) from normalized EBITDA; challenge any capex classification that inflates free cash flow
- Model the full working capital cycle; establish a normalized working capital requirement as a percent of revenue
- Calculate DSCR at the normalized base case and at a minimum 20% EBITDA stress scenario
- Ensure DSCR exceeds 1.25x in the base case and remains above 1.0x in the stress case
✅ Step 5: Document and Stress Test
- Prepare a formal EBITDA bridge table in the credit memo showing each layer from reported to stress-case EBITDA
- Run a minimum of three scenarios: base, downside (-15% EBITDA), and severe stress (-25% to -30% EBITDA)
- Test leverage and coverage at each scenario; ensure covenant levels are calibrated with meaningful headroom at the base case and a survivable path at the downside
- Require a Quality of Earnings report from an independent accounting firm on transactions above your internal threshold
✅ Key Documentation Requirements
- Three years of audited or reviewed financial statements
- Seller’s add-back schedule with supporting documentation for each item
- Independent QoE report (buy-side, commissioned by lender or lead arranger)
- Customer revenue schedule (top-10 minimum, top-20 preferred)
- Capex schedule distinguishing maintenance from growth capital expenditures
- Working capital analysis and proposed closing working capital peg
- Management compensation benchmarking
Key Takeaways for Credit Practitioners
- The seller’s EBITDA is a negotiating position, not a credit fact. Every add-back requires independent verification, and the aggregate adjustment percentage should be calculated, benchmarked, and documented before any credit decision is made.
- EBITDA and cash flow are not the same number. The free cash flow conversion ratio, maintenance capex burden, and working capital cycle must all be analyzed before sizing a loan, a business generating $9M in EBITDA but only $4M in free cash flow after capex and working capital has a fundamentally different risk profile than its headline leverage multiple suggests.
- Recurring “non-recurring” costs are a structural red flag. If a cost appears in the add-back schedule two or more years in a row, it is not non-recurring. Underwriters who accept these adjustments systematically overstate debt capacity and understate leverage.
- Market context amplifies EBITDA risk. With the leveraged loan default rate projected to reach 7.9% in Q1 2026, more than double the historical average, and with first-lien recovery rates for LME-affected credits running approximately 57% below those of issuers who did not conduct an LME, the cost of a normalized EBITDA error in underwriting has never been higher.
- Covenant calibration begins with EBITDA normalization. Financial maintenance covenants (leverage, coverage, and liquidity tests) are only protective if they are set against a credible, independently normalized earnings base. Covenants set against an inflated EBITDA provide the appearance of protection without the substance. Stress-testing covenant headroom at both the base case and the downside is a non-negotiable step in any institutional underwriting process.


