
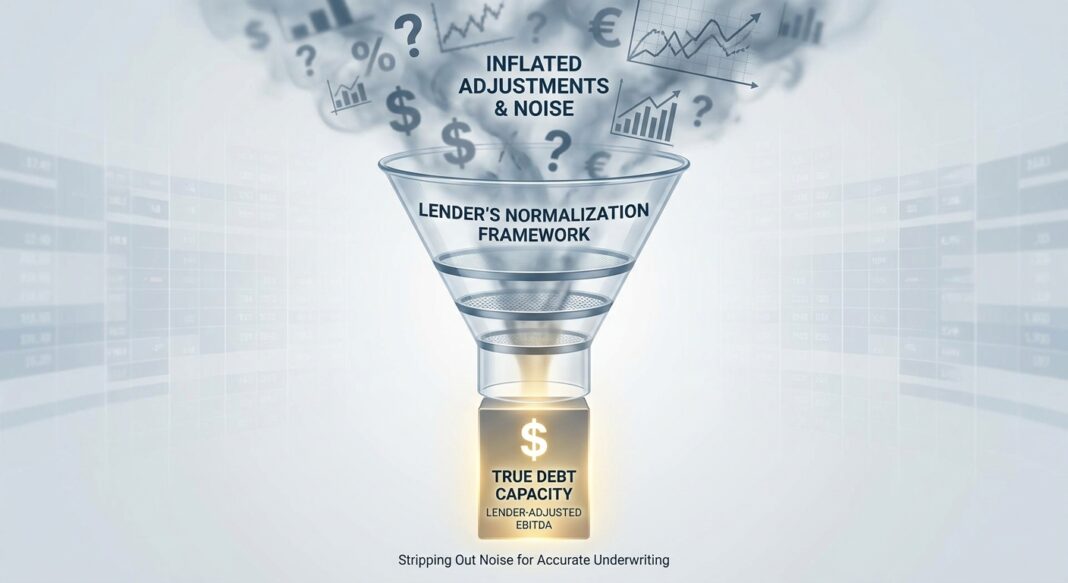
EBITDA Adjustments & Normalization: The Lender’s Framework for Stripping Out Noise and Underwriting True Debt Capacity
September 23, 2026
The Underwriting Challenge: Which EBITDA Are You Actually Lending Against?
A sponsor presents a manufacturing company with $10 million in reported EBITDA. By the time the deal memo lands on the credit committee table, the management-adjusted EBITDA is $13.2 million: a 32% premium driven by a stack of add-backs including owner compensation normalization, one-time legal costs, a plant relocation charge, and projected synergies from a not-yet-signed supplier contract.
Which number should the lender underwrite? The answer is neither. Credit underwriters must independently construct a third figure: lender-adjusted EBITDA: the conservative, evidence-backed, covenant-ready earnings number that honestly reflects what cash flow is available to service debt under normal, ongoing operating conditions.
This distinction is not academic. Consider the mechanics: if the lender accepts the $13.2 million figure and advances debt at 4.5x leverage, the borrower carries $59.4 million in obligations. If the lender’s own review strips $2.5 million of unsupported add-backs, landing at $10.7 million, the same leverage multiple implies $48.2 million in debt capacity. That $11.2 million gap is the difference between a credit that works and one that struggles at the first covenant test.
The quality of EBITDA normalization is, in effect, the quality of the underwriting itself. Getting it right is the foundation of every leverage ratio, every coverage test, and every covenant structure in the credit agreement.
The Framework: Three Layers of EBITDA and How Lenders Navigate Them
Experienced credit professionals operate with a clear mental hierarchy of EBITDA definitions. Each layer serves a different purpose, and conflating them is one of the most common and consequential errors in deal underwriting.
Layer 1: Reported EBITDA
Derived directly from GAAP financial statements: Net Income + Interest Expense + Income Tax Expense + Depreciation & Amortization. This is the starting point. It contains no adjustments and anchors the analysis in audited or reviewed figures.
Layer 2: Company-Adjusted EBITDA
Management’s proposed version, presented in the CIM or management deck. It reflects the seller’s or sponsor’s view of sustainable earnings and typically includes every favorable adjustment the deal team believes is supportable. As one practitioner framework notes, this layer “reflects management’s proposed changes” to reported EBITDA, and it is where advocacy bias is most concentrated.
Layer 3: Lender-Adjusted EBITDA
The underwriter’s independent recalculation after applying haircuts, rejecting unsupported add-backs, and inserting replacement costs. This is the figure the credit committee approves, and it governs debt sizing. Covenant-defined EBITDA, embedded in the credit agreement, may follow a slightly different formula, and lenders must understand the divergence between the underwriting figure and the contractual one before signing.
Key Metrics Generated From Lender-Adjusted EBITDA
- Total Leverage (Debt/EBITDA): Primary sizing constraint. Middle-market direct lenders typically underwrite to 4.0x–5.5x for senior secured; tighter for cyclical sectors.
- Interest Coverage Ratio (EBITDA/Interest Expense): A minimum of 2.0x–3.0x is a common institutional threshold at underwriting.
- Fixed Charge Coverage Ratio (FCCR): (EBITDA – CapEx – Taxes – Distributions) ÷ (Debt Service). A minimum FCCR of 1.15x–1.25x at underwriting is a standard institutional floor.
- Debt Service Coverage Ratio (DSCR): Used as the primary covenant test in many direct lending structures. Institutional lenders require a minimum 1.25x DSCR for initial acquisitions.
Example: Analyzing a $10M EBITDA Manufacturing Business
| Line Item | Amount |
|---|---|
| Net Income (GAAP) | $3,200,000 |
| + Interest Expense | $1,400,000 |
| + Income Tax | $900,000 |
| + D&A | $4,500,000 |
| = Reported EBITDA | $10,000,000 |
| + Owner Excess Compensation (documented, benchmarked) | $600,000 |
| + One-Time Legal Settlement (resolved, no recurrence) | $400,000 |
| + Non-Cash Stock Compensation (challenged by lender) | $300,000 ⚠ |
| + Projected Synergies, Unsigned Contract (rejected) | $900,000 ❌ |
| + Plant Relocation Charge (partially accepted) | $250,000 |
| = Seller-Adjusted EBITDA | $12,450,000 |
| – Rejected: Unsigned contract synergies | ($900,000) |
| – Rejected: SBC add-back (real compensation cost) | ($300,000) |
| – Replacement CEO Salary (market rate vs. owner draw) | ($350,000) |
| = Lender-Adjusted EBITDA | $10,900,000 |
At 4.5x leverage, the $1.55M delta between seller and lender EBITDA translates to ~$7M less in gross debt capacity, a material deal-structuring consequence.
The Analysis: Walking Through Specific Add-Back Categories
1. Owner Compensation Normalization
In owner-operated businesses, above-market owner draws and compensation packages are legitimate add-backs, but only after deducting the market cost to replace the owner’s operational role. Excess compensation adjustments represent the largest single category of add-backs in lower middle-market deals. The key underwriting discipline: every add-back must be paired with a replacement cost analysis. Adding back $800K of owner comp while ignoring the $350K CFO hire required post-close creates a one-sided margin profile that will not survive covenant testing.
2. Non-Cash Stock-Based Compensation (SBC)
SBC add-backs have become a flashpoint in the 2025–2026 credit market. Institutional lenders have broadly tightened their posture: SBC represents real economic value transferred to employees and dilutes shareholders; it is not a free add-back. Many private equity lenders now exclude SBC entirely when calculating debt capacity, because adding it back inflates leverage capacity against compensation costs that will recur in some form.
3. One-Time and Non-Recurring Costs
These are the most contested category. A legal settlement is one-time only if the underlying dispute is resolved and does not indicate a pattern. Restructuring charges, facility closures, and systems-implementation costs all require documentation that the expense is complete and non-recurrent. The red flag: companies that book a new “one-time” charge every year. If the trailing three-year income statement shows a recurring “non-recurring” line item, the lender should treat it as an operating cost.
4. Synergy and Run-Rate Add-Backs
Projected synergies are the most aggressive category and deserve the most scrutiny. Best institutional practice now requires synergies in covenant calculations only if they are realizable within 18 months of closing and documented by an independent accounting firm. Phantom cost saves from unexecuted headcount reductions and revenue from unsigned customer contracts should be rejected outright.
Stress Testing the Lender-Adjusted Figure
After constructing lender-adjusted EBITDA, responsible underwriting requires running a downside scenario. A common framework applies a 15–20% EBITDA haircut to simulate a revenue softening or margin compression event, then tests whether the resulting coverage ratios still exceed covenant minimums. Using the example above: a 20% stress on $10.9M produces $8.72M. At the proposed debt structure, does FCCR still clear 1.15x? If not, the credit is understructured and covenant headroom needs to be rebuilt through lower leverage or additional equity.
Industry Standards: What the Data Says About EBITDA Discipline and Credit Performance
The relationship between EBITDA quality and credit outcomes is not theoretical, the default and distress data from 2024–2026 validate underwriting discipline as the primary protective variable.
📊 Data Box: Credit Performance Benchmarks (2024–2026)
- Private Credit Default Rate (2025): Moody’s estimates the private credit default rate ranged from approximately 1.6% (excluding distressed exchanges) to 4.7% (including them), reflecting how definition choices materially alter the risk picture. (Source: Moody’s, April 2026)
- Distressed Exchanges as % of All Defaults: Approximately 65% of all corporate defaults in 2025 were distressed exchanges rather than hard defaults, the highest annual share on record. (Source: Moody’s Ratings, July 2026)
- Leveraged Loan Default Rate: The trailing 12-month conventional payment default rate for U.S. leveraged loans stood at 1.36% as of August 2025; the combined rate including distressed liability management exercises reached 4.37% by issuer count. (Source: PitchBook LCD, via Valuation Research Corp., 2026)
- Selective Defaults vs. Conventional Defaults: S&P Global found that selective defaults outpaced conventional defaults approximately 5:1 in 2024, driven by loose covenant packages and payment-in-kind structures that deferred rather than resolved underlying stress. (Source: S&P Global Market Intelligence, 2025)
- Covenant-Lite Risk: Loans that eliminate maintenance covenants, removing the lender’s early warning system when a borrower deteriorates, were a significant driver of 2025 default cycle damage. (Source: Angel Investors Network / Cliffwater CDLI analysis, 2026)
- EBITDA Add-Back Composition: Owner compensation normalization is the largest single add-back category in lower middle-market deals, averaging 35% of total adjustments. (Source: BDO 2024 QoE Benchmark Study, via CT Acquisitions analysis)
Common Red Flags Institutional Lenders Watch For
- 🚨 Add-Back Stack Exceeds 20% of Reported EBITDA. Any adjustment bridge that inflates reported earnings by more than 20% warrants heightened scrutiny and independent QoE verification.
- 🚨 Revenue Add-Backs Without Customer Documentation. Projected revenue from unsigned contracts, anticipated price increases without invoice evidence, or new products not yet in production belong in the upside model, not the underwriting base case.
- 🚨 Recurring “Non-Recurring” Charges. If restructuring, integration, or “one-time” charges appear in consecutive years of financial statements, the underwriter must normalize them as a cost of doing business, not an exception.
- 🚨 SBC Add-Back Without Replacement Cost Analysis. Treating stock-based compensation as a purely non-cash, costless item ignores dilution economics and the competitive labor market reality.
- 🚨 Covenant-Defined EBITDA Diverges Significantly from Underwriting EBITDA. When the credit agreement definition is materially more generous than the lender’s underwriting figure, the borrower may appear covenant-compliant while cash flow is actually deteriorating.
The EBITDA Normalization Underwriting Checklist
The following diligence points reflect institutional best practice for any private credit transaction where EBITDA normalization is material to the underwriting decision.
✅ Source Document Verification
- Obtain 3 years of audited or reviewed financial statements (GAAP basis)
- Request trailing-twelve-month (TTM) management accounts, reconciled to last fiscal year-end
- Require independent QoE for all transactions with adjusted EBITDA above $3M or where add-backs exceed 15% of reported EBITDA
- Reconcile bank statements to income statements to tax returns (Cash Proof), confirm reported revenue and profit correspond to actual cash movements
✅ Add-Back Triage
- Categorize every add-back as Green (independently documented, auditor-acceptable), Yellow (negotiable, partial credit), or Red (rejected)
- Apply independent market-rate replacement cost to all owner compensation adjustments
- Reject all synergy add-backs without signed contracts, executed headcount plans, or 18-month realization timelines
- Challenge SBC add-backs; at minimum, model the credit both with and without SBC to understand sensitivity
- Test whether any “one-time” items appear in multiple periods, reclassify as recurring if so
✅ Leverage and Coverage Stress Tests
- Calculate Total Debt / Lender-Adjusted EBITDA, confirm within sector-appropriate leverage policy
- Calculate FCCR using (EBITDA – CapEx – Cash Taxes – Distributions) ÷ Total Debt Service; confirm ≥ 1.15x–1.25x
- Run a 15–20% EBITDA downside scenario; verify that coverage ratios still exceed covenant minimums
- Model rising interest rate sensitivity for floating-rate structures
✅ Covenant Architecture
- Confirm the covenant-defined EBITDA in the credit agreement aligns closely with lender underwriting EBITDA
- Set maintenance covenant levels with meaningful headroom (typically 20–30% cushion) relative to base case
- Include quarterly financial reporting obligations and periodic QoE refresh triggers on material add-backs
- Negotiate cure rights with equity injection provisions as a backstop, not as a substitute for tight underwriting
✅ Questions to Ask Management
- Can you provide source documentation for every add-back exceeding $50,000?
- Has this expense appeared in any prior year? If so, why is it non-recurring this cycle?
- What is the replacement cost if the owner-operator exits the business within 12 months of close?
- Are the projected cost saves already reflected in a signed agreement or executed action plan?
- How does the business perform under a 20% revenue decline? What costs are truly variable?
Key Takeaways
- Lender-adjusted EBITDA is the only number that matters for underwriting. Reported EBITDA is the starting point; company-adjusted EBITDA is advocacy. The underwriter’s independent figure (built from verified add-backs and net of replacement costs) is what drives debt sizing and covenant calibration.
- The gap between seller EBITDA and lender EBITDA is a leading risk indicator. When a borrower’s adjustment bridge inflates reported earnings by more than 20%, the credit committee should require an independent Quality of Earnings review before advancing to term sheet. Unsupported add-backs removed at underwriting do not reappear as cash flow post-close.
- Distressed exchanges are today’s default proxy, and loose add-back definitions enable them. With approximately 65% of 2025 corporate defaults structured as distressed exchanges rather than hard payment events, the link between covenant-defined EBITDA generosity and deferred credit stress is direct and measurable.
- SBC and synergy add-backs require categorical discipline. The market has moved: lower middle-market sponsors in 2026 routinely exclude stock-based compensation add-backs at underwriting, and synergy credits now require independent documentation and 18-month realization windows. Lenders who haven’t updated their add-back policies are carrying legacy risk.
- Stress testing is not optional; it is the proof of work. Any EBITDA normalization exercise that does not conclude with a 15–25% downside scenario, checked against covenant minimums, is incomplete. The purpose of credit underwriting is not to build the most optimistic case for a deal; it is to rigorously define the conditions under which the credit fails, and to ensure the structure survives them.


