
Underwriting & Risk Management | Credit Analysis
October 9, 2026, Bond Capital Editorial Desk
The Underwriting Challenge: When the Numbers Don’t Mean What They Say
A borrower presents a Confidential Information Memorandum showing $10 million in EBITDA. The sponsor’s adjustments (restructuring charges, management add-backs, anticipated cost saves) close the gap between $7.2 million in reported earnings and that headline figure. The lender is being asked to underwrite a 5.0x leverage transaction. But at what EBITDA?
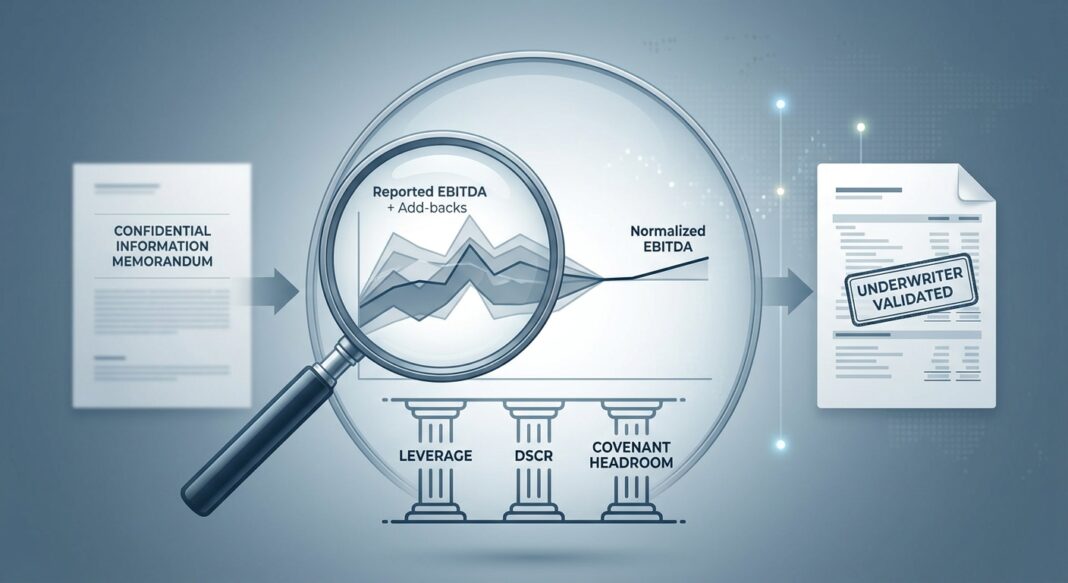
This is the central tension in private credit underwriting. As one practitioner framework puts it plainly, the most important question in buyer underwriting is: which version of EBITDA is being multiplied? Every add-back that is inflated, unverified, or non-recurring in name only directly distorts leverage ratios, covenant headroom, and debt service coverage, the three pillars of credit safety. Every dollar of inflated or unjustified Adjusted EBITDA has a disproportionate impact on valuation and deal returns, and the consequences compound across a portfolio.
In today’s credit environment, the bridge between reported and adjusted EBITDA is no longer an administrative formality. It is a primary diligence surface. Buyers, lenders, and institutional investors are all demanding greater rigor. The question is whether the underwriting desk is equipped to supply it.
The Analytical Framework: Building a Credible Earnings Bridge
Normalized EBITDA and adjusted EBITDA are related but distinct concepts that underwriters must not conflate. Normalized EBITDA answers a specific question: what did this business actually earn on a representative, sustainable basis? Adjusted EBITDA is broader; it may incorporate run-rate savings, pro forma acquisition synergies, and buyer-specific cost assumptions that have not yet been realized. Lenders and institutional buyers underwrite normalized earnings and discount pro forma projections.
The practitioner formula for normalized EBITDA is straightforward:
Normalized EBITDA = TTM Reported EBITDA + Owner Add-Backs + One-Time / Non-Recurring Items + Non-Cash Charges + Related-Party Resets − Non-Recurring Income
The trailing twelve months (TTM) window is the preferred measurement period. It captures the most recent full operating cycle, limits the distortion of single-quarter shocks, and reflects current run-rate conditions more accurately than calendar-year financials alone.
Institutional lenders broadly recognize four adjustment categories in loan contract definitions:
- Non-cash items: depreciation, amortization, non-cash compensation, unrealized mark-to-market losses.
- Extraordinary / non-recurring items: isolated litigation settlements, one-time facility closure costs, non-repeating restructuring charges.
- Capital expenditure deductions: maintenance capex is a real cash cost and should be deducted when sizing free cash flow for debt service.
- Owner economics and related-party normalization: above- or below-market compensation, related-party rent, and intercompany charges must be reset to market equivalents.
Example: Analyzing a $10M EBITDA Manufacturing Company
A sponsor presents the following EBITDA bridge for a regional specialty manufacturer:
| Item | Amount | Status |
|---|---|---|
| Reported EBITDA (TTM) | $7,200,000 | Starting point |
| Owner compensation excess over market replacement | $800,000 | Accepted (documented) |
| One-time legal settlement (resolved) | $600,000 | Accepted (no ongoing exposure) |
| Restructuring charges (2nd consecutive year) | $400,000 | Challenged, recurring pattern |
| Pro forma “run-rate” cost saves (not yet implemented) | $500,000 | Rejected, not in base period |
| Below-market lease from owner (related-party reset) | ($300,000) | Add-down applied |
| Underwriter’s Normalized EBITDA | $8,700,000 | Conservative base |
The gap between the sponsor’s $10M and the underwriter’s $8.7M is $1.3M. At a 5.0x leverage multiple, that difference implies $6.5 million in excess debt capacity being claimed against earnings that do not yet exist or do not withstand scrutiny.
Walking the Calculations: From EBITDA to Debt Capacity and Coverage
Once a defensible normalized EBITDA is established, the underwriting team translates it into three core metrics that govern credit approval and covenant design.
1. Total Leverage (Debt / EBITDA)
Using the manufacturer example above, with $43.5M in proposed senior debt:
- Sponsor’s leverage: $43.5M / $10.0M = 4.35x
- Underwriter’s leverage: $43.5M / $8.7M = 5.0x: the same transaction looks materially riskier on a validated EBITDA base.
For middle-market transactions, institutional lenders typically target entry leverage of less than 4.5x Debt/EBITDA on a validated basis, with first-lien senior secured positioning and maintenance covenant protection. Upper-middle-market leverage ratios frequently exceed 5.0x, which is associated with materially higher interest burden and lower coverage cushion.
2. Debt Service Coverage Ratio (DSCR)
DSCR measures how much normalized cash flow is available to cover all debt obligations (principal + interest). The formula used in institutional underwriting is:
DSCR = (Normalized EBITDA − Maintenance Capex − Cash Taxes − Working Capital Changes) / (Annual Interest Expense + Scheduled Principal)
Continuing the example: assume $3.4M in annual debt service on the $43.5M facility and $800K in maintenance capex:
- Free Cash Flow for Debt Service: $8.7M − $0.8M = $7.9M
- DSCR: $7.9M / $3.4M = 2.32x
Most middle-market commercial lenders set minimum DSCR covenants at 1.25x, with a strong preference for 2.0x or above. If overly aggressive EBITDA normalization is used, DSCR may appear acceptable on paper but fail during underwriting, one of the most common reasons credit approvals are conditioned or reversed.
3. Stress Testing the Base Case
A disciplined underwriting team runs three scenarios against normalized EBITDA: a base case (as-underwritten), a stress case (EBITDA -20%), and a severe stress case (EBITDA -35%). The covenant leverage threshold is typically set with a 25–35% cushion to the sponsor’s projected EBITDA, sufficient to absorb ordinary volatility without immediate breach, but tight enough to signal deterioration early. Cushions above this range produce “cov-loose” structures that provide lenders little actionable protection.
Industry Standards: What Institutional Lenders Require
The institutional direct lending market has moved decisively toward tighter underwriting standards as the credit cycle matures. Several data points frame the current environment:
📊 Credit Performance Data Box
- Private Credit Default Rate (2025, CDLI): The Cliffwater Direct Lending Index posted a 1.45% default rate in 2025 alongside a 9.3% net return, a 20-year average of 9.5% with only one negative year. Non-accruals and realized losses remained below historical averages. (Source: Cliffwater / Morningstar, March 2026)
- Fitch U.S. Private Credit Default Rate (April 2026): Fitch, applying a broader default definition, reported the U.S. private credit default rate reaching a record 6.0% in April 2026. Moody’s estimated that distressed restructurings (debt exchanges and maturity extensions agreed under pressure) accounted for roughly 65% of all private credit defaults in 2025. (Source: Investing.com / Private Credit 2026 Analysis)
- High-Yield Speculative-Grade Default Rate: S&P reported speculative-grade default rates above 4% in late 2025, while Fitch projected 4.0%–4.5% for U.S. corporate bonds. Moody’s projected a potential decline toward approximately 2.5% over the following year as conditions stabilized. (Source: CoinLaw Corporate Bond Default Statistics, 2026)
- Morgan Stanley Direct Lending Default Warning: Morgan Stanley has warned that direct lending default rates (running at approximately 5.6%) could reach 8%, well above the 2–2.5% historical average. Analysts described such a spike as “significant but not systemic,” with stress concentrated in software and leveraged healthcare. (Source: CAIA Association, April 2026)
- Typical Direct Lending Transaction Structure (2026): A typical direct lending transaction features a first-lien senior secured loan at SOFR plus 400–600 basis points, a four-to-six year term, maximum leverage covenants around 4x EBITDA, and minimum interest coverage near 2.5x. (Source: Investing.com / Private Credit 2026 Analysis)
Common Red Flags in EBITDA Normalization
Experienced underwriters watch for specific warning patterns that signal inflated or unreliable earnings:
- Recurring “non-recurring” items: Restructuring charges, legal costs, or consulting fees that appear in two or more consecutive periods should be treated as operating expenses. Relabeling ongoing costs as one-time is one of the most prevalent forms of EBITDA inflation.
- High add-back concentration: When more than 25% of EBITDA is composed of run-rate savings and non-cash add-backs, independent validation should be required and underwriting EBITDA should be haircut if validation is unavailable.
- Unimplemented cost saves: Anticipated cost savings that depend on post-closing actions should be rejected from the normalized EBITDA base. If over half of projected run-rate savings are not realized within nine months post-close, lenders should mandate updated plans and covenant reset discussions.
- Stock-based compensation (SBC) add-backs: Many PE buyers and lenders cap SBC add-backs or require dual EBITDA presentation because adding back genuine compensation costs inflates debt capacity against non-cash earnings. Lenders should not extend credit against earnings inflated by this add-back.
- PIK interest as a stress indicator: The Financial Stability Board has flagged that the use of certain payment-in-kind (PIK) arrangements is positively correlated with borrower stress. PIK loans allow borrowers to defer cash interest payments by adding them to loan principal, providing near-term liquidity while increasing total debt and long-term credit risk. A rising PIK share in a portfolio is a portfolio-level warning signal.
- Missing add-downs: A credible normalized EBITDA schedule must include both add-backs and add-downs. Below-market owner salaries, below-market related-party rent, and non-recurring income (one-time contract wins, insurance proceeds) must be removed from the earnings base. Sellers tend to omit these adjustments, and underwriters must surface them independently.
The EBITDA Normalization Underwriting Checklist
Before finalizing an EBITDA base for credit approval, underwriters should work through the following diligence sequence:
-
☐ Obtain and reconcile 3 years of audited financials + TTM management accounts.
Map every EBITDA line to GAAP financials. Confirm the TTM period and flag any audit qualifications or restatements. -
☐ Build an independent add-back schedule, do not rely on the seller’s QoE as the final answer.
Lender-provided schedules are a starting point. The underwriting team must independently evaluate and document each adjustment. -
☐ Test every “non-recurring” item against two prior periods.
If the item appears in consecutive periods, it is recurring. Reclassify it to operating expense and remove from the add-back schedule. -
☐ Reset all related-party transactions to arm’s-length market equivalents.
Owner compensation, lease payments, management fees, and intercompany charges must all be normalized to market replacement cost. Apply add-downs where the business benefits from below-market arrangements. -
☐ Exclude all pro forma, run-rate, and synergy adjustments from the base EBITDA used in leverage calculation.
These may appear in a separate “upside case” model but should not anchor the debt sizing. Lenders and institutional buyers underwrite the first and discount the second. -
☐ Calculate maintenance capex and deduct from EBITDA before computing free cash flow for DSCR.
EBITDA is not free cash flow. Maintenance capex is a real obligation. Working capital requirements and cash taxes should also be modeled. -
☐ Apply an add-back concentration test.
If non-cash and run-rate add-backs collectively exceed 25% of unadjusted EBITDA, trigger an additional independent validation requirement or apply a haircut before covenant setting. -
☐ Set covenants off the underwriter’s validated EBITDA, not the sponsor’s projected figure.
Leverage covenant cushions of 25–35% below the sponsor’s projected EBITDA are standard in direct lending. Calibrate to signal deterioration early, not after the business is already in distress. -
☐ Document post-close monitoring triggers for run-rate savings.
Any cost saves included in the underwriting model should have a defined realization timeline (typically nine months) with quarterly tracking requirements and covenant reset provisions if milestones are missed. -
☐ Stress test the normalized EBITDA base against -20% and -35% revenue scenarios.
Confirm DSCR remains above 1.0x and leverage remains within covenant through both stress scenarios. If either breaks below floor thresholds, require additional equity cushion or structural protection.
Key Takeaways for Credit Underwriters
- 💡 Normalized EBITDA is the most contested number in any credit transaction. The difference between a sponsor’s adjusted figure and the underwriter’s validated base can translate into millions of dollars in implied debt capacity. At an 8.0x multiple, a $320,000 EBITDA dispute represents $2.56 million of enterprise value, and the lender bears the downside.
- 💡 Normalization must work in both directions. A credible earnings bridge includes add-downs (below-market compensation, non-recurring gains, one-time revenue events) not just add-backs. Sellers who omit add-downs erode credibility and invite retrades during diligence.
- 💡 Run-rate savings and pro forma adjustments belong in the upside model, not the base case. Anticipated cost saves that depend on post-closing actions should not anchor debt sizing. If those savings are not realized within nine months, the leverage ratio deteriorates against a debt load that was sized to a number that no longer exists.
- 💡 The credit market is bifurcating on underwriting discipline. The Cliffwater CDLI posted a 1.45% default rate in 2025 with steady non-accruals, while Fitch’s broader measure hit a record 6.0% in April 2026. The divergence reflects manager selection and underwriting rigor, not broad-based credit deterioration. Platforms that maintain disciplined earnings validation are navigating the cycle; those that chased yield on inflated EBITDA are restructuring.
- 💡 Covenant calibration is meaningless without EBITDA integrity. A leverage covenant set at 5.5x against an inflated $10M EBITDA base effectively provides no protection when the validated base is $8.7M. Setting covenants off the underwriter’s number, with a 25–35% cushion to the sponsor’s projection, preserves the ability to intervene before impairment becomes irreversible.


