
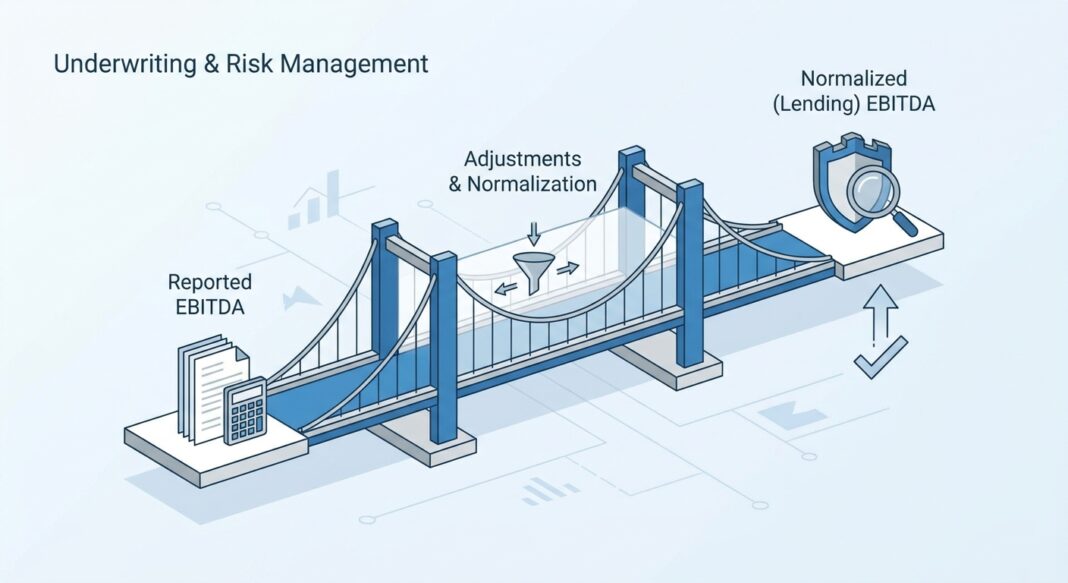
EBITDA Adjustments & Normalization: The Credit Underwriter’s Discipline for Defending Lending EBITDA in Leveraged Transactions
August 27, 2026
When a sponsor’s CIM claims $12M in Adjusted EBITDA and your independent underwriting lands at $9.5M, you’ve just found $2.5M of phantom earnings, and potentially a deal that doesn’t work. Here’s how experienced lenders build a defensible, normalized EBITDA from the ground up.
The Underwriting Problem: Whose EBITDA Are You Actually Lending Against?
Every leveraged credit transaction begins with a deceptively simple question: How much cash does this business actually generate? The answer, as any seasoned lender knows, is rarely what the marketing document says it is.
Sellers and their advisors have a structural incentive to present the highest defensible EBITDA figure. Buyers and their lenders have the opposite mandate, to underwrite to the number that reflects sustainable, post-close economic reality. The gap between those two figures is not a rounding error. It is the single greatest source of leverage misjudgment in middle-market credit underwriting.
The stakes are high. S&P Global Ratings’ longitudinal analysis of EBITDA add-backs found that marketing EBITDA at deal inception, including all add-backs, “generally does not provide a realistic indication of future EBITDA,” with reported EBITDA in one cohort coming in as much as 36–39% below management projections. At a 6.0x multiple, a $1M downward EBITDA revision is a $6M swing in enterprise value, and a direct hit to lender coverage ratios.
Understanding the difference between Reported EBITDA, Adjusted EBITDA, and Normalized (Lending) EBITDA, and how to build each layer independently, is a foundational skill for any credit professional. This article provides the framework.
The Analytical Framework: Three Layers of EBITDA
Experienced lenders don’t accept a single EBITDA figure. They build a layered earnings bridge that moves from reported financials through adjustments to a final, lender-underwritten number. Each layer serves a different purpose and carries a different burden of proof.
Layer 1: Reported (GAAP) EBITDA
The starting point. Calculated directly from audited or reviewed financial statements: Net Income + Interest Expense + Tax Expense + D&A. This is the only number with external verification. Any movement from here requires documented justification.
Layer 2: Adjusted EBITDA
The seller’s presentation. Adds back non-recurring, non-cash, and one-time items to approximate a cleaner earnings run-rate. Common categories include transaction costs, one-time legal settlements, severance tied to restructurings, and non-recurring consulting fees. Windsor Drake’s adjusted EBITDA guide defines this as “the bridge from reported financials to a cleaned-up earnings number after removing one-time and non-operating items.” The problem: sellers often include adjustments that are neither one-time nor clearly non-operational.
Layer 3: Normalized (Lending) EBITDA
The lender’s number. This goes further than Adjusted EBITDA by reflecting the earnings a buyer can sustainably underwrite after accounting for steady-state staffing requirements, market-rate compensation, necessary reinvestment costs, and the elimination of owner-specific economics that will not transfer. Critically, Normalized EBITDA can be lower than Adjusted EBITDA when the business requires incremental costs under new ownership.
Worked Example: $10M EBITDA Manufacturing Business
| Line Item | Amount | Lender Assessment |
|---|---|---|
| Reported GAAP EBITDA | $8,200,000 | Verified from CPA-reviewed financials |
| (+) Owner compensation above market | $600,000 | Partially accepted: $400K accepted after $200K market replacement cost deducted |
| (+) One-time legal settlement | $250,000 | Accepted: matter resolved, no ongoing exposure confirmed by counsel |
| (+) Transaction advisory fees | $300,000 | Accepted: clearly tied to sale process |
| (+) Projected cost savings (not yet realized) | $700,000 | Rejected: no track record; post-closing execution risk unquantifiable |
| (+) Related-party rent normalization | $180,000 | Accepted: third-party lease comps confirm below-market rate |
| Seller’s Adjusted EBITDA | $10,230,000 | Presented in CIM |
| Lender Normalized EBITDA | $9,330,000 | After rejecting $700K unearned savings and haircut on owner comp |
At a 5.0x leverage multiple, this $900K EBITDA delta means the lender underwrites $4.665M in senior debt capacity, not $5.115M. The difference is $450K in additional debt the lender would have been incorrectly extending.
Walking Through the Calculations: From EBITDA to Debt Service Coverage
Normalized EBITDA is not the finish line; it is the input into every downstream credit metric. Here is how lenders cascade that number through the underwriting model:
Step 1: Calculate Total Leverage
Total Debt / Normalized EBITDA = Total Leverage Multiple
Using our example: $46.65M proposed debt / $9.33M normalized EBITDA = 5.0x leverage. According to data cited by ABF Journal, middle market first-lien debt averaged 4.5x leverage as of September 2024, while average leverage across S&P’s broader U.S. middle market credit population reached 7.0x in 2024, illustrating significant dispersion in how aggressively deals are structured.
Step 2: Calculate Interest Coverage (EBITDA / Interest Expense)
Assuming an all-in rate of approximately 9.5% on $46.65M: annual interest ≈ $4.43M. EBITDA Interest Coverage = $9.33M / $4.43M = 2.11x. This is workable but leaves limited headroom. The benchmark concern: average interest coverage ratios in private credit have declined from 3.2x in 2021 to approximately 1.5x in recent periods, with the proportion of borrowers below 1.5x interest coverage now standing at 47% of the market.
Step 3: Stress-Test the Coverage Ratio
Apply a downside scenario, a 10% EBITDA contraction to $8.4M. Coverage compresses to 1.90x. Apply a 15% contraction: $7.93M EBITDA produces 1.79x coverage: approaching the typical maintenance covenant trigger of 1.75x. S&P’s own mild stress scenario, a 10% EBITDA drop combined with a 50-basis-point rate increase, pushes over 25% of middle-market firms below 1.0x coverage. This stress exercise is not optional; it is the minimum standard.
Step 4: Debt Service Coverage Ratio (DSCR)
DSCR moves from EBITDA to cash flow by subtracting maintenance capex, cash taxes, and working capital needs. DSCR = (EBITDA – CapEx – Cash Taxes – ΔWorking Capital) / (Interest + Scheduled Amortization). Lenders in leveraged transactions generally require DSCR ≥ 1.10x–1.20x at close, with covenant triggers set at 1.00x–1.05x.
What Institutional Lenders Know: Red Flags, Credit Data, and Market Standards
The Add-Back Red Flag Hierarchy
Not all add-backs are created equal. Institutional lenders evaluate adjustments on a spectrum from high-confidence to high-risk:
- Standard acceptance: D&A (non-cash by definition), non-recurring transaction fees with clear documentation, resolved legal matters with counsel confirmation
- Conditional acceptance: Excess owner compensation (only after deducting market replacement cost), implemented price increases supported by invoices and customer retention data
- High scrutiny / likely rejection: Projected cost synergies not yet realized, forward-looking run-rate revenue from unsigned contracts, pro-forma acquisitions without operating history
- Automatic rejection: Recurring items relabeled as one-time, buyer-specific synergies presented as seller EBITDA, indefinite savings with no implementation timeline
The academic evidence is unambiguous. Research from the University of Houston’s Bauer College of Business found that higher use of non-GAAP EBITDA add-backs increases the likelihood of loan delinquency and default, and also increases the probability of a borrower ratings downgrade, because they systematically understate actual future leverage and credit risk.
A practical lender’s rule of thumb from private credit practice: if more than 25% of underwriting EBITDA comprises run-rate savings and unverified non-cash add-backs, require independent third-party validation and apply hard caps. If validation is unavailable, haircut the underwriting EBITDA before setting covenant levels.
📊 Credit Performance Data Box
| Metric | Data Point | Source |
|---|---|---|
| S&P trailing 12-month HY default rate (Sept 2025) | >4%, forecast 4.25% by June 2026 | S&P Global via Valuation Research Corp., 2026 |
| Direct lending default rate, PE-backed (2024 forecast) | 2.75% sponsored rate | KBRA DLD Analytics |
| Long-term avg. recovery: 1st lien senior secured loans (trading price basis) | ~65% (ultimate recovery basis: ~71%) | BMA / Moody’s Data, Sept 2024 |
| Cov-lite vs. covenanted recovery penalty (2014–2017 cycle) | 72¢ vs. 82¢ on the dollar | S&P Global Ratings via Angel Investors Network, 2026 |
| Avg. middle-market leverage (PGIM, Q3 2024) | 4.5x first-lien vs. 5.8x BSL market | ABF Journal / PGIM, 2025 |
| Marketing EBITDA vs. actual EBITDA (2018 deal cohort) | Reported EBITDA 36–39% below marketing projections 2 years post-close | S&P Global Ratings Leveraged Finance Handbook, 2022 |
| Private credit borrowers with ICR below 1.5x | 47% as of 2025 (vs. 7% in Q4 2020) | WithIntelligence / IMF FSR Data, 2025 |
The Compounding Danger: EBITDA Inflation Cascades Into Covenants
A frequently overlooked structural risk: covenant baskets in credit agreements are often sized as a percentage of EBITDA. When EBITDA is inflated at close through aggressive add-backs, every EBITDA-linked basket (permitted debt incurrence, restricted payment capacity, investment permissions) also inflates. Research confirms that this “contributes to incremental event risk as many covenant baskets are tied to EBITDA,” understating actual future leverage throughout the life of the loan.
The EBITDA Normalization Underwriting Checklist
Use this framework as a minimum diligence standard when evaluating any seller-presented Adjusted EBITDA schedule in a leveraged transaction:
📋 Phase 1: Source Document Verification
- ☐ Obtain 3 years of audited or CPA-reviewed financial statements (tax returns as supplement)
- ☐ Reconcile Adjusted EBITDA bridge back to GAAP net income, every line item, no exceptions
- ☐ Confirm fiscal year-end consistency; flag any changes in accounting methods
- ☐ Request trailing twelve months (TTM/LTM) financials with monthly breakdown
- ☐ Identify revenue seasonality patterns that may distort annualized figures
📋 Phase 2: Adjustment-by-Adjustment Interrogation
- ☐ Require third-party support for every add-back above $50K (invoices, counsel letters, board minutes)
- ☐ Test owner/officer compensation against market-rate benchmarks for an operational replacement hire
- ☐ Validate related-party lease or management fee normalizations with independent comps
- ☐ Challenge any “one-time” expense that appears in more than one period, by definition, it is recurring
- ☐ Apply zero credit to projected synergies or cost saves without a realized track record
- ☐ Flag pro-forma acquisitions: require at least 6–12 months of actual combined operating data
📋 Phase 3: Build the Lender’s Independent EBITDA
- ☐ Construct your own earnings bridge independently from the seller’s schedule
- ☐ Apply conservative haircuts to adjustments with incomplete or ambiguous documentation
- ☐ Segment EBITDA by business line or geography if material product/segment risk exists
- ☐ Set a cap: flag any deal where total add-backs exceed 25% of reported EBITDA for escalated review
📋 Phase 4: Downstream Metrics & Covenant Architecture
- ☐ Build base, downside (–10% EBITDA), and severe downside (–20% EBITDA) cases
- ☐ Calculate DSCR under each scenario (EBITDA – CapEx – Cash Taxes – ΔWC) / (Interest + Amortization)
- ☐ Set financial maintenance covenants off the lender’s normalized EBITDA, not the seller’s adjusted number
- ☐ Include independent cash dominion and liquidity triggers that operate separately from EBITDA covenants
- ☐ Confirm all EBITDA-based covenant baskets reflect the conservative underwriting figure
📋 Phase 5: Ongoing Monitoring Protocol
- ☐ Require quarterly compliance certificates with reconciliation to underwriting EBITDA
- ☐ Track add-back realization, flag any projected cost save not evidenced within 9 months post-close
- ☐ Monitor interest coverage trajectory: escalate review if ICR approaches 1.5x
- ☐ Re-underwrite normalized EBITDA annually using the same bridge discipline applied at close
Key Takeaways for Credit Professionals
- Seller EBITDA is a starting point, never a conclusion. Institutional lenders construct an independent normalized EBITDA bridge with each adjustment individually documented, tested, and, where unrealized, rejected. The discipline at this stage is the primary defense against leverage misjudgment.
- The adjustment gap is systematically material. S&P Global Ratings’ analysis of large-cap LBO transactions found that marketing EBITDA at deal inception exceeded actual realized EBITDA by approximately 30% on average in the two years following origination, a finding with direct implications for every leveraged credit underwritten against management projections.
- Add-backs above 25% of reported EBITDA require elevated scrutiny. When total adjustments exceed a quarter of base EBITDA, the underwriting case rests heavily on unverified assumptions. Lenders should require independent validation, apply hard caps, and set covenant triggers off the more conservative figure, not the headline number.
- EBITDA inflation cascades through the entire credit agreement. Because covenant baskets, incurrence tests, and restricted payment capacity are often sized as multiples of EBITDA, an inflated base figure loosens the entire protective architecture of the loan, not just the coverage ratio. Covenants must be set off the lender’s normalized number.
- Cash is the ultimate discipline. Borrowers can inflate Adjusted EBITDA through add-backs; they cannot print cash. Lenders should supplement EBITDA-based covenants with independent liquidity triggers and cash dominion provisions that activate independent of earnings metrics, because interest and amortization require actual cash, not adjusted earnings.


