
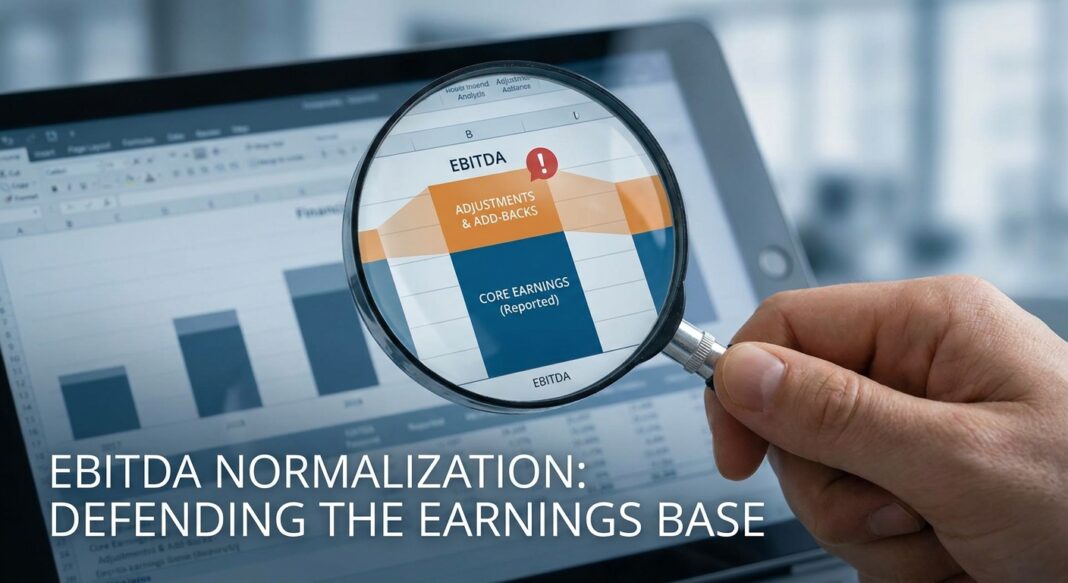
The Underwriting Challenge: When Earnings Are a Moving Target
A sponsor brings you a $10M EBITDA manufacturing business. By the time the deal team has finished layering in management add-backs (one-time legal fees, owner compensation normalization, COVID-era revenue adjustments, and projected cost savings) that number has climbed to $14.2M. The leverage multiple looks manageable on paper. The debt service coverage ratio clears your threshold. The deal gets done.
Eighteen months later, the business is generating $9.1M in EBITDA. The leverage covenant is breached. The lender is in a workout.
This is not a hypothetical. S&P Global Ratings’ multi-year study of leveraged buyout transactions found that EBITDA add-backs for deals originated in 2022 represented nearly 55% of last-12-month reported EBITDA at deal inception, and that management projections consistently failed to materialize, with median leverage misses of 2.3 turns in year one and 2.7 turns in year two post-close. The conclusion was unambiguous: marketing EBITDA is not a reliable indicator of future cash flow generation.
For credit underwriters, the discipline of EBITDA normalization is not merely technical bookkeeping. It is the foundational act of underwriting rigor, the line between deploying capital responsibly and underwriting on fiction.
The Analytical Framework: Building a Defensible Earnings Base
The starting point for any credit underwriting is understanding precisely what EBITDA you are lending against. Two terms dominate deal documentation, and distinguishing between them matters.
Reported EBITDA is the raw figure from audited or management-prepared financials: Revenue minus operating expenses, before interest, taxes, depreciation, and amortization. It is the most conservative and least disputed number.
Adjusted (or Normalized) EBITDA is a modified figure that removes items lenders and buyers agree are non-representative of ongoing operations. The adjustment can move in either direction (upward for one-time expenses, downward for non-recurring revenue) but in practice, seller and sponsor presentations almost always adjust upward.
A sound normalization framework follows a three-step process:
- Start with audited financials (or CPA-reviewed statements) as your base. Never accept a management-prepared schedule as a starting point without independent verification.
- Apply a tiered add-back test. Categorize each proposed adjustment as (a) clearly supportable, (b) judgment-dependent, or (c) indefensible. Only the first category should be credited in full; the second requires documentation and haircut; the third is removed entirely.
- Sensitize the output. Run your normalized EBITDA through at least three scenarios: base case, downside (10–20% EBITDA compression), and severe stress (25–35% compression) to test covenant headroom and coverage at each level.
Example: Analyzing a $10M EBITDA Manufacturing Company
Consider a middle-market industrial manufacturer with the following presented financials at deal inception:
| Line Item | Amount ($M) |
|---|---|
| Reported EBITDA (LTM) | $10.0 |
| + Owner excess compensation add-back | $1.2 |
| + One-time legal settlement | $0.6 |
| + Non-recurring restructuring costs | $0.5 |
| + “Run-rate” cost savings (not yet implemented) | $1.4 |
| + Pro forma revenue from new contract | $0.5 |
| Management Adjusted EBITDA | $14.2 |
A disciplined underwriter would immediately challenge the $1.4M in unimplemented cost savings and the $0.5M pro forma contract contribution. These are forward-looking projections presented as historical earnings, a structurally aggressive normalization approach. After removing these items and applying a modest haircut to the restructuring add-back pending documentation, the underwriter’s defensible normalized EBITDA is $11.5M: a $2.7M difference that meaningfully changes the leverage and coverage picture.
Walking the Numbers: Key Metrics and Stress Testing
With a normalized EBITDA of $11.5M and a proposed debt package of $46M (4.0x leverage), the core coverage metrics look as follows:
| Metric | Formula | Base Case | Downside (−15%) | Stress (−30%) |
|---|---|---|---|---|
| Total Leverage | Debt / Norm. EBITDA | 4.0x | 4.7x | 5.7x |
| Interest Coverage (ICR) | EBITDA / Interest Expense | 3.2x | 2.7x | 2.2x |
| DSCR | EBITDA / (Interest + Principal) | 1.45x | 1.23x | 0.99x |
| Fixed Charge Coverage (FCCR) | (EBITDA − Capex − Taxes) / Debt Service | 1.30x | 1.10x | 0.88x |
The stress scenario produces a DSCR below 1.0x and an FCCR under 1.0x, signaling that a 30% earnings compression would make the borrower unable to service debt from operating cash flow alone. This is a critical early warning signal that the capital structure carries insufficient cushion. A prudent lender would either reduce leverage to 3.5x, require a cash sweep mechanism, or demand a meaningful equity contribution buffer before proceeding.
Note also that had the underwriter used management’s $14.2M adjusted EBITDA, the base-case DSCR would have appeared a comfortable 1.82x, masking the structural fragility entirely. This is why independent normalization is not optional; it is the underwriter’s primary line of defense.
Industry Standards, Red Flags, and Credit Performance Data
What Institutional Lenders Look For
Experienced credit investors apply a consistent filter to EBITDA adjustments. The framework used by most institutional direct lenders distinguishes between add-backs that are documented, historical, and non-recurring versus those that are projected, speculative, or management-driven. Only the former category earns full credit in underwriting.
Commonly accepted add-backs include: excess owner compensation above market replacement cost, non-cash charges (with scrutiny applied to stock-based compensation), documented one-time legal or settlement costs, and transaction-related professional fees. Each must be supported by third-party evidence: invoices, court filings, compensation surveys, or auditor confirmation.
Red Flags: Add-Backs That Should Never Pass Diligence
- Unrealized run-rate synergies: Adding back future cost savings that have not yet been implemented conflates forward projections with historical performance. As one practitioner note puts it, “adding back $20m of future synergies to today’s EBITDA is adding future value to a historical number.”
- Missed budget add-backs: Adjustments premised on “what EBITDA would have been” if management had executed better are speculative and have no place in a credit underwriting model.
- Late-cycle COVID revenue adjustments: Pandemic-era revenue add-backs lack credibility in 2025–2026 underwriting contexts and should be challenged or removed entirely.
- One-sided margin adjustments: If a seller adjusts revenue upward for a non-recurring event, the cost structure must move symmetrically. Add-backs that improve margin without acknowledging the cost of sustaining the revenue base produce an internally inconsistent earnings profile.
- Stock-based compensation (SBC) add-backs used for debt capacity: SBC is non-cash but represents real economic value transferred to employees. Extending credit capacity based on EBITDA inflated by SBC add-backs overstates true cash debt service capacity.
📊 Data Box: EBITDA Add-Backs and Credit Performance
- S&P Global Ratings (6th Annual Add-Back Study, 2024): EBITDA add-backs for large M&A and LBO transactions originated in 2022 represented ~29% of management-projected EBITDA and nearly 55% of LTM reported EBITDA at deal inception. Median leverage was 2.3 turns higher than projected in year one and 2.7 turns higher in year two.
- S&P Global Ratings (2025 Forecast): The U.S. speculative-grade default rate was forecast to fall toward 3.75% by June 2025, from 4.57% in June 2024. The U.S. leveraged loan default rate was expected near 1.5% through mid-2025 under base-case conditions.
- Moody’s (Leveraged Loan Default Rate, July 2025 Report): The leveraged loan default rate was projected to end 2025 at approximately 7.5% (including distressed exchanges), with a rise to ~7.9% in Q1 2026, remaining well above the 3.4% historical average.
- Recovery Rates (Moody’s / S&P, 2024–2025): Long-term average issuer-weighted recovery on first-lien bank loans based on trading prices post-default is approximately 65%, versus 38% for senior unsecured bonds. However, S&P Global Ratings expects first-lien recoveries to come in below historical averages, citing the rise of covenant-lite structures and loan-heavy capital stacks with diminished junior debt cushions.
- Cliffwater Direct Lending Index (CDLI), 2017–2024: The broader CDLI (covering both senior and non-senior loans to middle-market borrowers) produced an estimated annualized credit loss of approximately 1.47%, underscoring the relative credit quality of directly originated middle-market loans versus syndicated leveraged credit.
- Covenant Maintenance, S&P Global (April 2025): More than one-third of private credit borrowers subject to leverage-based maintenance covenants had headroom above 40%, suggesting that many covenants were set wide at inception and may not provide meaningful early-warning protection in a stress scenario.
The Underwriting Checklist: EBITDA Normalization Due Diligence
Use the following step-by-step framework on every credit that presents a management-adjusted EBITDA figure above reported earnings.
Step 1: Obtain Source Documentation
- ☐ Request three years of audited or CPA-reviewed financial statements (not management-prepared summaries).
- ☐ Obtain the full add-back schedule with line-by-line descriptions and supporting documentation for each item.
- ☐ Review the Quality of Earnings (QoE) report if one has been prepared; note whether it was commissioned by the buyer or the seller.
Step 2: Classify Each Add-Back
- ☐ Category A (Supportable): Documented, historical, non-recurring, and verifiable by third-party evidence. Credit in full.
- ☐ Category B (Judgment-Dependent): Partially recurring or supported only by management assertion. Apply a 50% haircut or require further evidence.
- ☐ Category C (Indefensible): Forward-looking, speculative, or tied to unimplemented initiatives. Remove entirely.
Step 3: Calculate Underwriter’s Normalized EBITDA
- ☐ Start from reported EBITDA; apply only Category A and haircut Category B items.
- ☐ Confirm that revenue-side adjustments are matched by symmetric cost adjustments.
- ☐ Verify that owner compensation normalization uses a documented market replacement cost benchmark.
- ☐ Deduct any non-cash add-backs (SBC, PIK interest) when calculating cash-based coverage ratios.
Step 4: Run Coverage Metrics and Stress Tests
- ☐ Calculate Total Leverage (Debt/EBITDA), ICR, DSCR, and FCCR at base, downside (−15%), and stress (−30%) EBITDA scenarios.
- ☐ Confirm DSCR remains above 1.0x in the downside scenario and identify the break-even EBITDA level.
- ☐ Test covenant headroom at each scenario: How much EBITDA erosion triggers the leverage covenant? Is there adequate cushion?
Step 5: Ask the Critical Questions
- ☐ If we remove all Category B and C add-backs, does the deal still clear our minimum credit hurdles?
- ☐ What percentage of adjusted EBITDA is composed of add-backs? Above 30% should trigger heightened scrutiny.
- ☐ Has the borrower historically achieved its own projections? Request prior-year management projections vs. actual results.
- ☐ Are there revenue concentration risks (e.g., one customer >25% of revenue) that create asymmetric downside?
- ☐ Does the QoE report confirm the add-back schedule, or does it identify downward adjustments that management has not disclosed?
Key Takeaways for Credit Underwriters
- ● Management EBITDA is a starting point, not a conclusion. Seller-provided add-back schedules should be treated as an opening negotiating position subject to independent verification and disciplined haircuts.
- ● The add-back size is predictive of projection failure. S&P Global’s multi-year study confirms a direct positive correlation between the magnitude of EBITDA add-backs at deal inception and the magnitude of management’s subsequent projection miss, larger add-backs reliably produce larger leverage misses.
- ● Stress-test coverage ratios, not just base cases. A DSCR that clears 1.25x at management EBITDA but falls below 1.0x at a 20% haircut is a structurally undercapitalized deal, not a credit-worthy one.
- ● Recovery assumptions must reflect current market structure. With covenant-lite structures prevalent and loan-only capital stacks increasingly common, first-lien recoveries are expected to remain below historical averages. Underwriting to 65–70% recovery on first-lien collateral in base case scenarios (and 45–60% in stress) is more defensible than assuming historical high-70s figures.
- ● Covenant design must be tight enough to actually matter. S&P Global data shows that more than one-third of private credit borrowers have leverage covenant headroom above 40%, wide enough that the covenant provides little practical early-warning signal. Maintenance covenants set within 15–20% of closing leverage levels preserve their function as a monitoring and intervention tool.


