
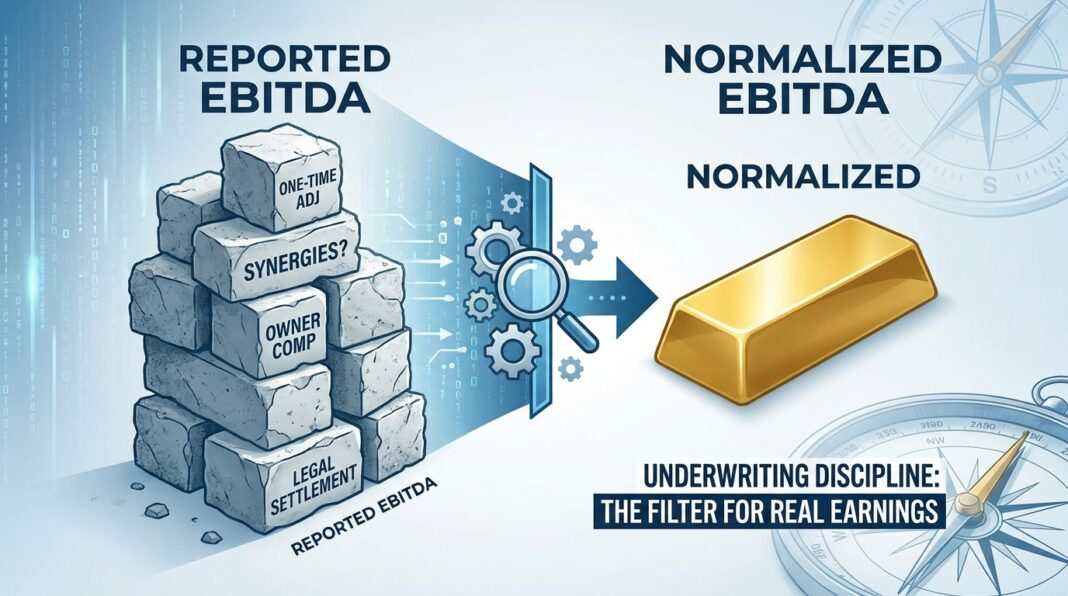
EBITDA Adjustments and Normalization: The Underwriting Discipline That Separates Real Earnings from Financial Fiction
In leveraged credit markets under mounting stress, EBITDA normalization is the single most consequential (and most frequently manipulated) number in a credit underwriting. Get it wrong, and every downstream metric (leverage, coverage, debt capacity, and covenant headroom) is built on sand.
The Underwriting Challenge: Which EBITDA Are You Actually Underwriting?
A middle-market manufacturing company presents its Confidential Information Memorandum. Reported EBITDA: $8.2M. Adjusted EBITDA on the management schedule: $11.7M. The proposed debt package assumes a 5.0x leverage multiple on that adjusted figure, implying roughly $58.5M in total debt. The Debt/EBITDA covenant is set at 6.0x. On paper, the company looks well-capitalised with meaningful headroom.
But here is the underwriting question every credit officer must ask before accepting that earnings base: Is the $11.7M real, repeatable, and financeable?
The $3.5M bridge between reported and adjusted EBITDA represents a 43% uplift, one of the most scrutinised gaps in today’s deal environment. Lenders and institutional investors have grown sharply more sceptical of aggressive EBITDA presentations. The macro backdrop reinforces why this scrutiny is warranted: competitive pressures have pushed underwriting standards, and the consequences of over-crediting add-backs are now visible across leveraged credit portfolios in the form of elevated defaults, distressed exchanges, and declining recovery rates.
This article teaches the full analytical framework for EBITDA normalization as a practitioner-grade underwriting discipline, not a rubber-stamp exercise on management’s numbers.
The Analytical Framework: Building a Lender-Grade EBITDA Bridge
There are three distinct versions of EBITDA that appear in any credit underwriting, and conflating them is the most common source of analytical error:
- Reported EBITDA: Derived directly from the GAAP income statement. The unvarnished starting point.
- Adjusted EBITDA: Management’s version, reported EBITDA plus all proposed add-backs. This is the seller’s ask, not the lender’s answer.
- Normalized EBITDA: The earnings base that survives independent diligence, reflects sustainable recurring operations, and is accepted by lenders in their own underwriting models. This is the only number that matters for debt sizing, covenant setting, and coverage analysis.
The Quality of Earnings (QoE) process is the mechanism for arriving at normalized EBITDA. A rigorous QoE review examines revenue recognition, customer concentration, revenue quality, gross margin trends, add-back documentation, accounting reserves, working capital behaviour, and the relationship between EBITDA and free cash flow. The purpose is not just to verify arithmetic; it is to determine whether the earnings base is accurate, repeatable, and financeable.
Categories of EBITDA Add-Backs: A Taxonomy for Lenders
| Add-Back Category | Typical Lender Acceptance | Key Diligence Requirement |
|---|---|---|
| One-time legal / litigation costs | High, if clearly non-recurring | Court filings, legal invoices, settlement documentation |
| Owner compensation above market rate | High, with market comp evidence | Comparable salary benchmarks; replacement cost analysis |
| Transaction & advisory fees | High, if deal-specific and non-recurring | Invoices; ensure not embedded in ongoing G&A |
| Restructuring & severance costs | Moderate, if truly non-recurring | HR records; verify no pattern of repeat charges |
| Pro-forma cost savings / synergies | Low to Moderate, requires track record | Implementation timeline; evidence of savings already realised |
| Pro-forma revenue from signed contracts | Low, buyers give minimal credit without history | Signed contracts; revenue recognition schedule |
| Stock-based compensation (SBC) add-back | Low, represents real economic cost | Treat as recurring cost; exclude from lender EBITDA for leverage ratios |
| Personal expenses run through business | Moderate, only if clearly personal in nature | Itemised receipts; personal vs. business purpose documentation |
The critical discipline: the cleanest add-backs are historical, fact-based, and can be independently verified. Any add-back that requires forward-looking assumptions (projected synergies not yet realised, pipeline revenues not yet contracted, cost reductions not yet implemented) should receive zero or heavily discounted credit in a lender’s own underwriting model.
Walking Through the Analysis: A $10M EBITDA Manufacturing Company
Consider a hypothetical manufacturing company with the following management-presented EBITDA bridge. The underwriting team’s job is to test every line.
| Line Item | Management Add-Back ($000s) | Lender Credit ($000s) | Lender Rationale |
|---|---|---|---|
| Reported EBITDA (TTM) | $8,200 | $8,200 | Verified from audited financials |
| Owner salary above-market adjustment | +$850 | +$650 | Replacement CEO benchmarked at $200K, not $50K as claimed |
| One-time legal settlement | +$420 | +$420 | Fully documented; case closed; no recurring exposure |
| Transaction advisory fees | +$350 | +$350 | Clear deal-related; non-recurring |
| Projected synergies from recent acquisition | +$1,200 | +$300 | Only 25% credit given, partial realisation evident; rest forward-looking |
| Personal expenses (vehicles, travel) | +$280 | +$180 | $100K deemed business-related after itemisation review |
| Stock-based compensation | +$400 | $0 | Real economic cost; excluded from leverage calculation |
| Adjusted / Normalised EBITDA | $11,700 | $10,100 | Lender-accepted earnings base |
The Downstream Impact on Leverage and Coverage
This $1.6M difference in normalized EBITDA (between management’s $11.7M and the lender’s $10.1M) has immediate consequences for every core credit metric:
- Leverage (Debt/EBITDA): On a $52M debt package, management’s EBITDA implies 4.4x leverage. The lender’s normalized EBITDA implies 5.1x, a materially more stressed capital structure.
- Interest Coverage (EBITDA/Interest): At a blended 8.5% all-in cost on $52M debt (~$4.4M annual interest), management’s EBITDA implies 2.66x coverage; lender’s normalized figure implies 2.30x, approaching the threshold where most credit committees require remediation.
- Debt Service Coverage Ratio (DSCR): Factoring in scheduled amortisation, DSCR on the lender-normalized EBITDA may fall below 1.10x, a critical stress threshold for most institutional lenders.
- Covenant Headroom: If the Maximum Leverage covenant is set at 6.0x using management’s EBITDA, the real headroom using the lender’s normalized figure is far narrower than the credit agreement implies.
⚠ The Multiplier Effect
A $1.6M EBITDA variance, applied at a 5.5x valuation multiple, represents $8.8M of enterprise value at risk. Accepting management’s unadjusted add-backs is not a conservative risk decision; it is uninformed underwriting.
Industry Standards: What Institutional Lenders Require in 2026
The current credit environment demands a materially higher standard of EBITDA diligence than was common during the 2020–2022 low-rate era. The data is unambiguous.
📊 Credit Performance Data Box
- Leveraged loan first-lien recovery rate: Par-weighted average first-lien recovery collapsed to 39% in 2024, down from 51% in 2023 and 76% in 2022, according to Fitch Ratings, meaning lenders cannot rely on collateral to compensate for loose underwriting at origination. (Source: Alternative Credit Investor / Fitch Ratings, April 2025)
- Leveraged loan default rate: Moody’s projected the leveraged loan default rate to end 2025 at 7.5% and peak at 7.9% in Q1 2026, nearly double the 3.4% historical long-run average. (Source: Moody’s Ratings, July 2025)
- Defaults concentrated in mid-market borrowers: J.P. Morgan data shows defaults are disproportionately concentrated among companies with $25M–$50M EBITDA, with a 3.38% default rate in 2025 for that cohort, more than double the 1.44% rate for companies with EBITDA above $50M. (Source: J.P. Morgan Private Bank, March 2026)
- PIK interest as a stress signal: In the direct-lending market, payment-in-kind (PIK) income reached approximately 8.8% in Q3 2025, up from roughly 4.2% pre-pandemic, a signal that cash interest coverage is under increasing pressure across private credit portfolios. (Source: Vanguard, February 2026)
- Distressed exchanges dominate defaults: Distressed exchanges accounted for 64% of all defaults in the first half of 2025, the highest annual share on record, and 35% of distressed exchanges led to repeat defaults within 48 months. (Source: Coinlaw / Moody’s data, 2025)
- True leverage may be understated: The Financial Stability Board’s May 2026 Vulnerabilities in Private Credit report noted that due to EBITDA adjustments, reported leverage in private credit may be understated, with analysis suggesting “true” leverage closer to 7x Debt/EBITDA for some borrowers. (Source: Financial Stability Board, May 2026)
Red Flags: When an EBITDA Bridge Should Trigger Heightened Scrutiny
- The add-back-to-reported EBITDA ratio exceeds 20–25%. A bridge that stretches reported EBITDA by more than 20% is a threshold for institutional-level concern. Every dollar of inflated or unjustified adjusted EBITDA has a disproportionate impact on valuation and debt capacity.
- Pro-forma add-backs for unrealised cost actions or unsigned contracts. Sellers sometimes include projected synergies from acquisitions not yet completed or revenue from contracts not yet executed. Institutional lenders give zero credit for pro-forma add-ons without an established track record.
- One-sided margin adjustments. If a seller removes costs but retains the revenue associated with those costs, the resulting margin profile is internally inconsistent. Removing expenses that drive revenue while keeping the revenue inflates normalised margins artificially.
- EBITDA-to-cash-flow divergence. If reported EBITDA is rising but operating cash flow is flat or declining, this is a strong signal of accounting adjustments, timing differences, or working capital deterioration obscuring true earnings power.
- Stock-based compensation add-backs applied to leverage calculations. SBC is non-cash, but it represents a real economic transfer of value to employees. Many experienced PE buyers and direct lenders explicitly exclude SBC when calculating Debt/EBITDA for leverage ratio purposes.
- Pattern of recurring "non-recurring" charges. If litigation costs, restructuring charges, or advisory fees appear in three consecutive years of financials, they are by definition recurring, and should not be added back.
Bond Capital Underwriting Checklist: EBITDA Normalization Diligence
📄 Phase 1: Financial Statement Foundation
- ☐ Obtain audited financials for minimum three trailing fiscal years plus latest TTM
- ☐ Reconcile management-prepared P&L against CPA-compiled or audited statements line by line
- ☐ Identify revenue recognition policies, are revenues recognised at point of delivery or percentage-of-completion?
- ☐ Review customer concentration: does any single customer represent more than 20% of revenue?
- ☐ Verify gross margin trends across all three years, unexplained margin expansion is a red flag
📄 Phase 2: EBITDA Bridge Analysis
- ☐ Build an independent EBITDA bridge, do not accept management’s schedule as a starting point
- ☐ Require primary documentation for every add-back above $25K: invoices, contracts, HR records, legal filings
- ☐ Categorise each add-back: historical/fact-based (high confidence) vs. forward-looking/pro-forma (low confidence)
- ☐ Calculate the add-back as a percentage of reported EBITDA, flag anything exceeding 20%
- ☐ Test owner compensation against third-party salary benchmarks for a comparable replacement executive
- ☐ Identify any items that have appeared in multiple years, reclassify as recurring
- ☐ Exclude SBC from the EBITDA base used for Debt/EBITDA leverage ratio calculations
- ☐ Apply a conservative discount (25–50%) to any pro-forma synergy or cost-save add-back without an implementation track record
📄 Phase 3: Cash Flow Reconciliation
- ☐ Reconcile normalised EBITDA to operating cash flow, any divergence greater than 15% requires explanation
- ☐ Calculate working capital intensity: is the business a net consumer or generator of cash as it grows?
- ☐ Identify maintenance CapEx vs. growth CapEx, maintenance CapEx must be deducted from EBITDA for true free cash flow analysis
- ☐ Calculate DSCR using lender-normalised EBITDA, less maintenance CapEx, less cash taxes, divided by total debt service (interest + scheduled amortisation)
📄 Phase 4: Downstream Credit Metrics
- ☐ Recalculate all leverage ratios (Total Debt/EBITDA; Senior Secured Debt/EBITDA) using lender-normalised EBITDA only
- ☐ Recalculate interest coverage (EBITDA/Interest Expense) at current all-in borrowing cost
- ☐ Stress test: apply a 20% EBITDA decline scenario, does coverage ratio hold above 1.20x? Does leverage breach covenant?
- ☐ Model covenant headroom under both the base case and the stress case using lender-normalised EBITDA
📄 Phase 5: Questions to Ask Management
- ☐ "Walk me through every add-back and provide the supporting documentation."
- ☐ "Have any of these costs reappeared in subsequent periods?"
- ☐ "What is the timeline and evidence base for the projected cost savings?"
- ☐ "Why does EBITDA growth outpace operating cash flow growth in years two and three of your projections?"
- ☐ "What is the market replacement cost for your key management team members?"
Key Takeaways for Credit Underwriters
- Always build an independent EBITDA bridge. Management’s adjusted EBITDA is a starting point and a negotiating position, not a concluded underwriting number. Lenders independently evaluate every add-back against primary documentation before applying any credit.
- The multiplier effect makes EBITDA errors extremely costly. At a 5.5x valuation multiple, every $1M of unjustified add-back represents $5.5M of over-stated enterprise value and over-leveraged debt capacity. In a cycle where first-lien recoveries have fallen to 39%, lenders cannot underwrite to inflated earnings and rely on collateral as a safety net.
- Declining recovery rates have fundamentally changed the risk calculus. With first-lien BSL recovery rates having dropped from 76% in 2022 to 39% in 2024 (Fitch Ratings), the historical assumption that senior secured lenders are well-protected in distress is no longer reliable. Disciplined origination, including rigorous EBITDA normalization, is the first and most important line of defence.
- Size matters for default risk. J.P. Morgan data confirms that borrowers in the $25M–$50M EBITDA cohort carried the highest default rates in 2025 (3.38%), more than twice those of larger borrowers. Lenders extending credit to mid-market companies must apply commensurately more conservative normalization assumptions, not less.
- EBITDA-to-cash-flow reconciliation is non-negotiable. The gap between normalized EBITDA and actual free cash flow (after maintenance CapEx, working capital requirements, and cash taxes) is where credit quality is ultimately determined. A well-constructed EBITDA bridge that does not reconcile to a credible cash flow statement is an incomplete underwriting.


