
Underwriting & Risk Management | Bond Capital
June 28, 2026
The Number on Page One Is Not the Number You Should Lend Against
Every credit memo begins with the same artifact: a management-prepared adjusted EBITDA schedule. It looks precise: columns of add-backs, footnoted explanations, a clean headline figure that conveniently supports the leverage ratio the sponsor needs to close. Experienced underwriters treat it as what it is: a starting point, not a conclusion.
EBITDA normalization sits at the intersection of accounting judgment, competitive deal pressure, and legal documentation. Get it wrong (accept an inflated number, let an unsupported add-back survive diligence, or size debt against earnings that will never materialize) and you have miscalculated the borrower’s debt capacity before the loan agreement is even signed. The downstream consequences land in your covenant tests, your coverage ratios, and ultimately your recovery analysis at default.
This article walks through the full normalization methodology that institutional credit underwriters apply: how to reconstruct adjusted EBITDA independently, which add-backs survive scrutiny, how the resulting number drives debt sizing and covenant design, and what the current credit environment tells us about the cost of getting this wrong.
The Analytical Framework: Reconstructing Earnings from Scratch
The formal underwriting view of EBITDA begins with a simple but powerful principle: lenders should independently reconstruct, not merely review, the borrower’s earnings base. Seller-provided normalization schedules are viewed as a starting point, not a conclusion, and every add-back must be traced to audited or reviewed financial statements before it is credited.
The normalization process has two distinct but related objectives. The first is historical normalization: removing non-recurring, non-operating, and owner-specific items from reported EBITDA to isolate repeatable operating cash generation. The second is determining the underwritable run-rate: the sustainable earnings figure on which debt capacity, leverage covenants, and coverage tests will actually be based post-close.
These are not the same thing, and conflating them is one of the most common underwriting errors in middle-market lending. Historical normalization is a backward-looking exercise grounded in documented evidence. Run-rate underwriting may incorporate forward-looking adjustments, but only those that are already contracted, already executed, or demonstrable through a clear operating history. Cost savings not yet implemented, synergies not yet realized, and revenue assumptions not yet earned belong in the sponsor’s return model, not the lender’s credit memo.
The Five-Layer Normalization Stack
Bond Capital’s underwriting framework applies five sequential layers of analysis to any borrower’s adjusted EBITDA presentation:
- Layer 1, Reported EBITDA Verification: Reconcile the seller’s reported EBITDA figure to audited financials or reviewed statements. Any discrepancy requires explanation before proceeding.
- Layer 2, Non-Recurring and One-Time Item Review: Identify and individually evaluate each claimed non-recurring item. Each must be documented, non-repeating, and clearly isolated from ongoing operations. Common examples include one-time legal settlements, restructuring charges, transaction fees, and business interruption proceeds.
- Layer 3, Owner-Specific Adjustments: Normalize compensation to market replacement cost. Adjust for related-party rent, above- or below-market management fees, and personal expenses run through the business.
- Layer 4, Downward Adjustments: Apply buyer-side discipline. Remove non-recurring revenue that inflated trailing results. Add back understated cost items (e.g., deferred maintenance, underpaid management). This step is frequently skipped by sellers and their advisors, and frequently missed by junior underwriters.
- Layer 5, Run-Rate and Pro Forma Adjustments: Apply only those forward-looking adjustments with documented support: annualized revenue from contracts already executed, cost eliminations already in force, or acquisitions with at least two full quarters of audited combined financial history.
Walking the Numbers: A $10M EBITDA Manufacturing Company
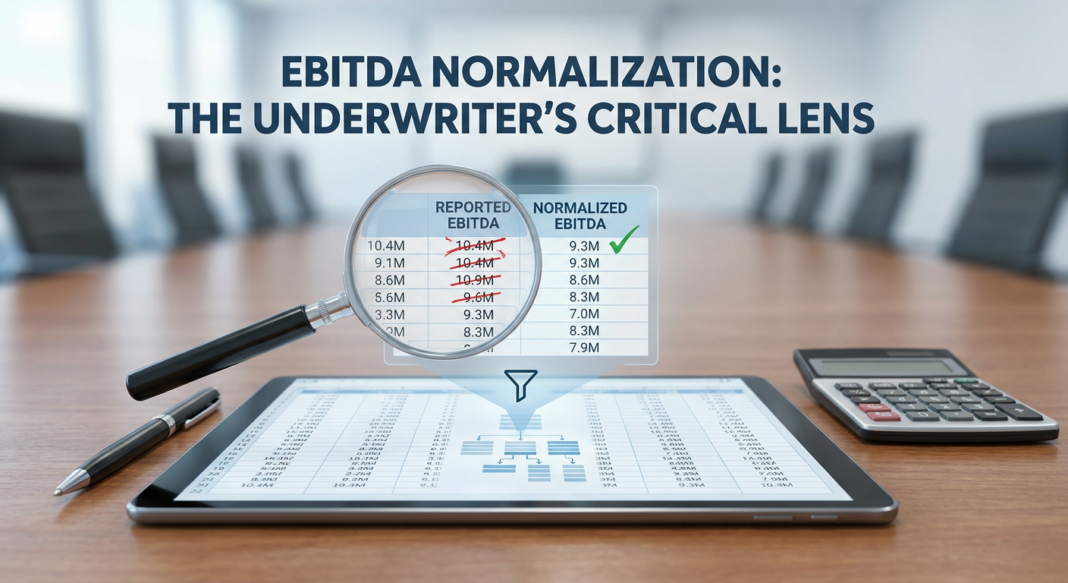
Consider a middle-market precision manufacturer presenting a $10.4M adjusted EBITDA to support a proposed $52M senior secured term loan, implying 5.0x leverage. The sponsor’s add-back schedule includes eight items totaling $2.1M above reported EBITDA of $8.3M. Here is how a disciplined underwriter works through each layer:
| Add-Back Item | Sponsor Claim | Lender Determination | Credit Given |
|---|---|---|---|
| One-time legal settlement | $400K | Supported by invoice & court record, clearly non-recurring | $400K ✓ |
| Owner excess compensation | $350K | Market CEO comp benchmarked at $250K, delta creditable | $100K (partial) |
| M&A transaction fees | $275K | Supported, lender-specific cap applied per credit agreement | $275K ✓ |
| Cost savings (not yet implemented) | $500K | No executed contracts, no documented headcount reduction, rejected | $0 ✗ |
| Stock-based compensation (non-cash) | $225K | Non-cash, creditable under loan definition | $225K ✓ |
| Revenue from contract signed post-LTM | $200K annualized | Contract executed, two invoices issued, partial credit given | $100K (partial) |
| Below-market related-party rent | $150K add-back | Lender requires market lease at close, rent normalizes upward, reducing EBITDA | -$75K (downward) |
| Net Adjustment to Reported EBITDA | +$2.1M (Sponsor) | +$1.025M (Lender) |
Result: The lender’s independently normalized EBITDA is $9.325M versus the sponsor’s $10.4M: a $1.075M gap that, at a 5.0x leverage multiple, translates to $5.4M less in supportable debt. The proposed $52M loan is now sized at 5.57x lender-underwritten EBITDA, a materially different risk profile than the deal memo suggests. The correct maximum debt at 5.0x is $46.6M.
This arithmetic is not hypothetical edge-case analysis. It is standard middle-market underwriting practice. The add-backs that lenders will not credit in their underwriting reduce available leverage, which either makes the deal uneconomic at the agreed purchase price or forces a price reduction to restore the target leverage ratio.
Industry Standards: What Institutional Lenders Look For in 2026
The stakes of EBITDA normalization have grown considerably as private credit has scaled. The Financial Stability Board’s May 2026 report on private credit vulnerabilities highlighted that leverage in private credit may be materially understated in reported figures, with true leverage potentially closer to 7x debt-to-EBITDA when EBITDA add-backs are critically assessed, well above the headline figures reported in credit memos. The FSB noted that adjustments allow borrowers wide flexibility, and that prior research in the leveraged loan market has found that management regularly misses projections embedded in pro forma add-backs.
McKinsey’s Global Private Markets Report (2026) found that average new-issue leverage in private credit was 4.9x EBITDA in 2025, down marginally from 5.0x in 2024 and 5.2x in 2023. However, this figure reflects the headline sponsor-presented EBITDA, not the independently normalized figure lenders should use. The gap between those two numbers is where credit risk accumulates.
On covenant structure, the market has bifurcated sharply. In the core lower middle market (companies with EBITDA below $100M), maintenance covenants remain the standard, providing lenders with the quarterly early-warning mechanism to engage with a borrower before performance deterioration becomes a default event. In the upper middle market and mega-deal segment, covenant discipline has eroded substantially, with approximately 30% of recent upper-middle-market deals structured as covenant-lite, and leverage tests, where they exist, often permit EBITDA to fall 30–40% before triggering a breach. New issue spreads have widened by roughly 50 to 100 basis points since late 2025, and new loans are increasingly structured with better credit terms (less leverage, more covenants, fewer PIK requests, and tighter documentation) reflecting a lender-friendly reset in deal terms.
📊 Credit Performance Data Box
- Leveraged Loan Default Rate (Moody’s, mid-2025): Projected at 7.5% for year-end 2025, nearly double the 3.4% historical average, with leveraged loan issuers exhibiting far more stress than high-yield bond issuers. Source: Moody’s Credit Strategy, July 2025
- High-Yield Bond Default Rate (Moody’s): Projected at 3.2% for 2025, rising above 4% by Q1 2026, still below the 4.5% historical average since 1996. Source: Moody’s Credit Strategy, July 2025
- Middle Market Default Rate (Fitch, 2025): 9.2% default rate reported across a specific monitored portfolio of 302 middle-market companies, suggesting stress in the middle market is materially more severe than aggregate indices imply. Source: Fitch, as cited by Angel Investors Network, June 2026
- Covenant-Lite Penetration (Broadly Syndicated): 91% of outstanding U.S. leveraged loans were covenant-lite at year-end 2024, approximately $1.29 trillion in face value, stripping lenders of quarterly early-warning mechanisms. Source: Resonanz Capital analysis, 2024
- Senior Secured Loan Recovery (Moody’s Ultimate Recovery Database): Bank loans recover an average of 82% at resolution on a discounted basis, versus 37% for bonds overall and as low as 15% for junior subordinated instruments. Recovery rates for loans with significant junior debt beneath them average 95%. Source: Moody’s Ultimate Recovery Database
- Median Interest Coverage (Kroll StepStone, Q3 2025): Global median interest coverage for senior and subordinated corporate debt improved to 2.09x EBITDA in Q3 2025, up from 1.83x a year earlier, a meaningful but still thin buffer at elevated debt service costs. Source: McKinsey Global Private Markets Report, 2026
- Covenant-Lite Growth in Direct Lending: Covenant-lite transactions rose to 21% of direct lending deals in 2025, up from 4% in 2023, concentrated in larger upper-market transactions. Source: McKinsey Global Private Markets Report, 2026
Common Red Flags in Adjusted EBITDA Schedules
- 🔴 Add-backs that recur every year: If a “one-time” legal cost or restructuring charge appears in two or more trailing twelve-month periods, it is an operating cost, not a normalization item.
- 🔴 Large unimplemented cost savings: Forward-looking cost synergies with no executed contracts, no documented headcount changes, and no operational history are the most commonly rejected add-back category. Lenders must apply zero credit or require an escrow or earn-out structure.
- 🔴 Revenues that outpace cash collections: An EBITDA bridge that does not reconcile to actual operating cash flow is a structural warning. If EBITDA rises but cash from operations does not follow, the gap is typically working capital deterioration, revenue pull-forward, or aggressive revenue recognition.
- 🔴 Underpaid or missing cost items: Related-party transactions at below-market rates, deferred maintenance, and below-market management compensation are downward adjustments that sellers systematically omit. Underwriters must independently benchmark each.
- 🔴 Pro forma EBITDA not grounded in audited history: Acquisition add-ons with fewer than two full quarters of combined operating history should receive minimal or no pro forma credit until the revenue and cost base is demonstrated.
The EBITDA Normalization Underwriting Checklist
Bond Capital’s credit team applies the following diligence sequence before accepting any EBITDA figure for debt sizing or covenant-setting purposes:
Documentation Requirements
- ☐ Three years of audited or CPA-reviewed financial statements (minimum two years for lower-middle-market companies)
- ☐ Trailing twelve-month management accounts with month-by-month P&L detail
- ☐ Independent Quality of Earnings (QoE) report from an approved accounting firm, not the seller’s auditor
- ☐ Supporting documentation for every add-back exceeding $25K (invoices, contracts, board resolutions, legal filings)
- ☐ Market compensation benchmarking study for any owner compensation normalization
- ☐ Third-party lease appraisal if related-party real estate is present
Analytical Steps: Executed by Credit Team Independently
- ☐ Reconstruct EBITDA from audited financials, do not start from the seller’s schedule
- ☐ Reconcile adjusted EBITDA to operating cash flow (FCF conversion test: EBITDA to CFO ratio should be >70% for industrial/services; lower ratios require explanation)
- ☐ Apply downward adjustments: above-market rents, understated management comp, deferred capex normalization
- ☐ Limit pro forma run-rate adjustments to contracted, executed items with at least one period of verified results
- ☐ Stress-test the normalized EBITDA in a downside scenario (typically -15% to -25% revenue reduction) to confirm debt service coverage at trough
- ☐ Calculate lender-adjusted leverage ratio: Total Debt ÷ Lender-Underwritten EBITDA (must not exceed policy maximum, typically 5.0–5.5x for senior secured middle market)
- ☐ Set covenant EBITDA definition in credit agreement to match the normalized figure, cap add-backs at 25–30% of reported EBITDA to prevent post-close covenant manipulation
Questions to Ask Management and Sponsor
- ☐ Has this specific add-back appeared in prior-year financials? If so, why is it non-recurring this time?
- ☐ For cost savings: What headcount has already been eliminated? What contracts have already been terminated? What is the timeline to full realization?
- ☐ For revenue run-rate adjustments: Can you provide the executed contract, the invoicing history, and a customer reference?
- ☐ What does operating cash flow look like relative to EBITDA over the past three years?
- ☐ Are there any related-party transactions not reflected in the add-back schedule?
Key Takeaways for Credit Underwriters
- 💡 Reconstruct, don’t review: Independent reconstruction of EBITDA from audited financials is non-negotiable. Reviewing a seller’s schedule for reasonableness is not underwriting; it is validation theater.
- 💡 Downward adjustments are as important as add-backs: Sellers systematically omit items that reduce normalized EBITDA. Owner undercompensation, below-market rent, and deferred maintenance are direct adjustments that belong in the lender’s base case, not ignored.
- 💡 The EBITDA definition in the credit agreement IS the covenant: An inflated EBITDA definition with uncapped add-backs creates a covenant that cannot be breached until the business is already in severe distress. Cap add-backs contractually at origination.
- 💡 Leverage is almost always understated at origination: According to current FSB and Moody’s research, reported leverage multiples in private credit likely understate true economic leverage once EBITDA add-backs are critically assessed. The lender’s own normalized number is the only defensible basis for debt sizing.
- 💡 Cash flow reconciliation is your early-warning system: EBITDA that consistently diverges from operating cash flow is a structural signal: of working capital deterioration, revenue quality problems, or aggressive accounting. Build the EBITDA-to-FCF bridge into every credit memo and monitor it quarterly.


