
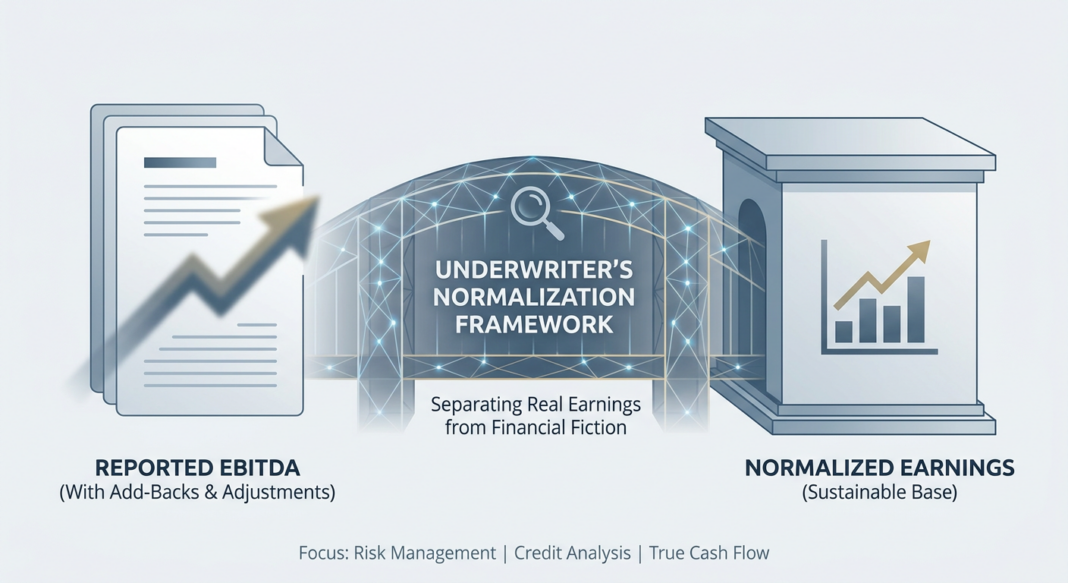
The Underwriting Challenge: When EBITDA Lies
Every private credit underwriter eventually faces the same moment: a Confidential Information Memorandum lands on the desk showing a $10M EBITDA manufacturing company at 4.5x leverage, a deal that looks clean on the surface. But buried in the footnotes are $2.1M in “one-time” add-backs, including a recurring consulting fee paid to the founder’s brother, a litigation settlement that happens every other year, and projected cost savings from a restructuring that has not yet begun.
Strip those out and the real EBITDA is closer to $7.9M. Leverage jumps to 5.7x. The deal looks entirely different.
This is the central underwriting challenge of the private credit market: EBITDA adjustments can materially inflate the earnings base upon which debt sizing, covenant thresholds, and pricing are all anchored. As Auxo Capital Advisors notes in its 2025–2026 M&A valuation practice update, buyers and lenders do not simply capitalize reported EBITDA; they pay a multiple of the earnings figure they believe is sustainable and supportable. For a lender, getting this wrong is not a valuation mistake. It is a credit mistake.
This article walks through the full EBITDA normalization methodology, from the reported number to the defensible lender underwrite, with calculations, red flags, and the institutional standards experienced credit professionals use to discipline the process.
The Framework: Building the EBITDA Bridge
Experienced lenders construct what practitioners call an EBITDA Bridge: a structured walk from GAAP-reported net income to a normalized, lender-underwritten earnings figure. The bridge has four stages:
- Reported EBITDA: Net income + Interest + Taxes + D&A (as filed)
- Adjusted EBITDA: Reported EBITDA + accepted non-recurring add-backs (e.g., transaction fees, one-time legal costs, documented restructuring charges)
- Normalized EBITDA: Adjusted EBITDA recalibrated to reflect sustainable, recurring earnings; owner-specific costs removed; run-rate revenues aligned to actual operations
- Pro Forma EBITDA: Normalized EBITDA ± forward-looking adjustments with documented execution evidence (e.g., signed backlog, contracted synergies)
The critical discipline is understanding which number belongs in which stage. According to Auxo Capital’s 2025–2026 middle-market lending analysis, normalized EBITDA is the number lenders try to underwrite, and it begins with reported results, incorporates only evidence-backed adjustments, and aligns the earnings narrative with revenue recognition, reserves, and working-capital behavior.
Common Legitimate Add-Backs vs. High-Risk Add-Backs
| Category | Signal | Lender Treatment |
|---|---|---|
| Non-market owner compensation / personal expenses | 🟢 Green Light | Accept with W-2/payroll evidence; replace with market-rate comp |
| Documented one-time legal settlement | 🟢 Green Light | Accept if non-recurring, verified via counsel letter |
| Transaction fees (M&A, financing) | 🟢 Green Light | Standard; may apply caps per loan agreement terms |
| “Temporary” cost cuts without contracts | 🟡 Yellow Light | Require vendor agreements or board approval; stress-test reversal |
| Projected cost synergies from incomplete restructuring | 🟡 Yellow Light | Accept only with implementation plan and track record of execution |
| Evergreen / recurring consulting fees labeled “one-time” | 🔴 Red Light | Reject; reclassify as permanent operating cost |
| Recurring discounts to customers reframed as margin improvements | 🔴 Red Light | Reject; analyze gross margin trend independently |
| Structural overhead that returns post-close | 🔴 Red Light | Reject; remodel with full cost base restored |
Source: Auxo Capital Advisors, 2025–2026 Middle Market Valuation Practice; Haynes and Boone / Practical Law Finance, 2024
Example: Analyzing a $10M EBITDA Manufacturing Company
Consider a mid-market manufacturer reporting $10.0M EBITDA. The sponsor’s CIM presents the following adjustments:
- $800K, Founder salary above market rate (owner comp normalization)
- $600K, ERP implementation costs (one-time, documentation available)
- $450K, Projected savings from headcount reduction (plan not yet implemented)
- $250K, Annual consulting agreement with related party (recurring, 4 years running)
Lender’s normalized walk:
- Accept founder comp adjustment: +$800K
- Accept ERP cost with receipts: +$600K
- Haircut headcount savings 50% pending execution: +$225K
- Reject related-party consulting (recurring): $0
Lender-underwritten EBITDA: $11.625M vs. the sponsor’s $12.1M claimed figure. On a 4.5x deal, that $475K gap translates to a $2.1M difference in acceptable debt capacity, meaningful at any middle-market deal size.
The Analysis: Metrics, Cash Conversion, and Stress Testing
Key Metrics Anchored to Normalized EBITDA
Once a defensible normalized EBITDA is established, the underwriting model builds the following core credit metrics:
- Total Leverage Ratio: Total Debt ÷ Normalized EBITDA. Per current market benchmarks, mid-market LBOs are underwritten at 4.0x–5.0x EBITDA as market standard, with lower middle market transactions typically ranging between 3.5x–4.5x. Anything above 5.5x requires exceptional credit quality.
- Interest Coverage Ratio (ICR): Normalized EBITDA ÷ Cash Interest Expense. Elevated rate environments have compressed this metric, the average EBITDA-to-interest coverage ratio in leveraged deals declined to approximately 3.1x in 2024, down from over 4.0x during 2019–2022. Lenders should stress-test coverage to 2.0x as a floor.
- EBITDA-to-FCF Conversion: The ratio of Free Cash Flow (EBITDA minus capex, taxes, and working capital changes) to EBITDA. A healthy manufacturing business should convert 55–70% of EBITDA to FCF. Conversion below 40% is a structural warning signal requiring explanation.
- Debt Service Coverage Ratio (DSCR): FCF ÷ (Interest + Scheduled Amortization). A minimum 1.15x DSCR is a common lender covenant threshold; 1.0x or below represents imminent stress.
Stress Testing the EBITDA Base
Normalized EBITDA is a point-in-time estimate. Prudent lenders apply three scenario tests:
- Base Case: Management projections with a conservative growth haircut (typically 50% of projected revenue growth)
- Downside Case: 15–20% EBITDA contraction reflecting cyclical revenue decline or margin compression; assess leverage and coverage at this level
- Severe Downside / Stress Case: 30–35% EBITDA decline with simultaneous working capital deterioration; test minimum liquidity and covenant headroom
A critical cross-check is EBITDA-to-cash reconciliation. As Mowery & Schoenfeld notes, if EBITDA goes up but the company isn’t bringing in more cash from its regular operations, that could mean the improved earnings are just on paper, such as from accounting changes or timing differences. Lenders should run a trailing 12-month cash flow reconciliation against the adjusted EBITDA figure and flag any gap exceeding 10%.
Industry Standards: What Institutional Lenders Require
The Tightening Diligence Standard
PKF Advisory’s 2025 transaction outlook confirms that lenders are tightening underwriting standards and that buyers increasingly want comfort with how EBITDA translates to free cash flows and how recurring and predictable that is. A Quality of Earnings (QoE) report, prepared by an independent accounting firm, has become a non-negotiable diligence requirement in most institutional private credit transactions. QoE analysis validates the full EBITDA bridge from GAAP to adjustments to normalized, and tests quality of revenue, reserve policies, and the cash conversion cycle.
Haynes and Boone’s 2024 Practical Law Finance guide notes that lenders will only consider adjustments that can be clearly justified and traced back to the company’s financial statements, and that lenders often use the most conservative EBITDA definition because it drives debt sizing, covenants, and repayment capacity.
Add-Back Risk in Practice
A Proskauer Rose survey cited by ABF Journal identifies EBITDA add-backs alongside covenant-lite structures as the two top risk factors in direct lending. The risk is especially acute in smaller borrowers: ICLG’s 2025–2026 Lending & Secured Finance report shows that of transactions containing leverage covenant step-downs, 67% involved companies with EBITDA below $50M: precisely the segment where add-back inflation risk is highest.
Hamilton Lane’s analysis warns that 2021-vintage deals levered above 6.0x on adjusted EBITDA could be above 8.0x on true cash flow, a direct consequence of aggressive add-back assumptions underwritten in a near-zero rate environment that no longer exists.
📊 Data Box: Credit Performance Benchmarks (2024–2025)
- Leveraged Loan Default Rate (H1 2025): Combined default rate (including distressed exchanges) at 4.37% by issuer count as of August 2025; conventional payment defaults at 1.36% trailing 12 months. (Source: Pitchbook LCD Distressed Weekly, via Valuation Research Corp.)
- Private Credit (Direct Lending) Default Rate: KBRA Direct Lending Index trailing 12-month default rate of 1.8% as of end-2024; lower middle market expected to reach 3% by year-end 2025. (Source: KBRA DLD, via Valuation Research Corp.)
- Fitch Privately Monitored Ratings Default Rate: U.S. private credit defaults reached 9.2% in 2025 within Fitch’s Privately Monitored Ratings universe, up from 8.1% in 2024, with the highest incidence among issuers with EBITDA of $25M or less. (Source: Fitch Ratings, via Securitas Global, 2026)
- First-Lien Recovery Rate: Long-term average ultimate recovery for 1st lien term loans of approximately 70–71% per Moody’s data. Covenant-lite structures may reduce expected recovery to the 50–65% range. (Source: Moody’s / Cambridge Associates / BMA Private Credit Deep Dive, 2024)
- EBITDA-to-Interest Coverage (2024): Average ICR in leveraged deals fell to approximately 3.1x, down from over 4.0x in 2019–2022. (Source: Private Capital Global / PGIM analysis, 2025)
- Distressed Exchanges: Moody’s data shows distressed exchanges accounted for 64% of all defaults in H1 2025, the same pace as full-year 2024, itself the highest annual share on record. (Source: Moody’s Ratings, July 2025 US Credit Review)
Common Mistakes and Red Flags
- Recurring items relabeled as one-time: The most frequent manipulation. Validate by reviewing 3–5 years of historical financials, not just the trailing 12 months presented in the CIM.
- Synergy add-backs without execution evidence: Projected savings must be accompanied by a demonstrated track record of similar initiatives. PKF Advisory notes that buyers expect a demonstrated history of successful execution of similar cost reduction initiatives.
- Revenue recognition timing games: Accelerated revenue booking in the diligence period inflates trailing EBITDA. Cross-reference deferred revenue balances, customer concentration, and contract renewal rates.
- Stock-based compensation treated as non-cash add-back: While technically non-cash, SBC represents real economic dilution and should be modeled as a cash cost or excluded from add-backs for senior lenders focused on debt repayment capacity.
- Working capital not reconciled: A rising EBITDA figure paired with deteriorating cash conversion is a structural warning. QoE-driven analysis should always include reserve policy drift and AP cut-off analysis as part of the EBITDA bridge validation.
Underwriting Checklist: EBITDA Normalization Due Diligence
Step 1: Obtain and Reconcile Source Documents
- ☐ Request 3 years of audited/reviewed financial statements (not just CIM summaries)
- ☐ Obtain detailed general ledger for the trailing 12 months
- ☐ Request tax returns for 3 years and reconcile to financial statements
- ☐ Obtain Quality of Earnings report from independent accounting firm (mandatory for deals above $5M EBITDA)
Step 2: Build and Challenge the EBITDA Bridge
- ☐ Map every add-back line item to source documentation (invoices, contracts, GL entries)
- ☐ Apply Green/Yellow/Red classification to each adjustment (see framework above)
- ☐ Test recurrence: Does each “one-time” item appear in any prior year?
- ☐ Validate cost savings and synergies against implementation plans and track record
- ☐ Identify any related-party transactions and assess at arm’s-length market rates
Step 3: Cash Flow Reconciliation
- ☐ Reconcile trailing 12-month EBITDA to operating cash flow; flag gap >10%
- ☐ Analyze working capital trends: DSO, DPO, and inventory turns over 3 years
- ☐ Assess maintenance capex vs. growth capex; confirm capex is not being deferred
- ☐ Calculate EBITDA-to-FCF conversion rate; stress-test to 40% floor scenario
Step 4: Stress Test and Covenant Calibration
- ☐ Run base, downside (−20% EBITDA), and severe downside (−35% EBITDA) scenarios
- ☐ Calculate leverage and ICR at each scenario; confirm maintenance covenant headroom of at least 25–30%
- ☐ Model PIK toggle impact on leverage trajectory; assess cumulative leverage at maturity
- ☐ Confirm first-lien position and lien perfection on all material collateral
Key Questions to Ask Management
- ☐ “Which of these add-backs have appeared in prior years’ financials?”
- ☐ “What is the contractual basis for the projected cost savings, and when do savings begin?”
- ☐ “How is revenue recognized, what triggers contract completion?”
- ☐ “What is the historical range of EBITDA margin over the last 5 years, including COVID?”
- ☐ “Are there any contingent liabilities, off-balance-sheet obligations, or earn-outs outstanding?”
Key Takeaways
- 🎯 The EBITDA you underwrite is not the EBITDA in the CIM. Build your own normalized figure using verified source documents. Adjusted EBITDA presented by sponsors is a negotiating starting point, not a credit conclusion.
- 📉 Add-back discipline drives loan quality. In the current default cycle, with distressed exchanges accounting for 64% of all defaults in H1 2025 (Moody’s), the seeds of credit deterioration are often planted at origination through inflated EBITDA and over-leveraged structures.
- 🔗 EBITDA must connect to cash. The only EBITDA figure that matters for debt service is the one that converts into free cash flow. Require a trailing 12-month cash reconciliation and flag EBITDA-to-FCF conversion below 50% as a structural concern.
- 📋 QoE reports are non-negotiable. An independent Quality of Earnings analysis remains the gold standard for validating the EBITDA bridge, testing revenue quality, and identifying reserve policy weaknesses before commitment.
- 🏛️ Structure around your normalized figure, not the sponsor’s claimed number. Covenant thresholds, leverage limits, and pricing grids should be calibrated to the lender’s conservative normalized EBITDA, with at least 25–30% headroom built into maintenance covenant levels to allow early warning and intervention before a technical default becomes a real one.


