
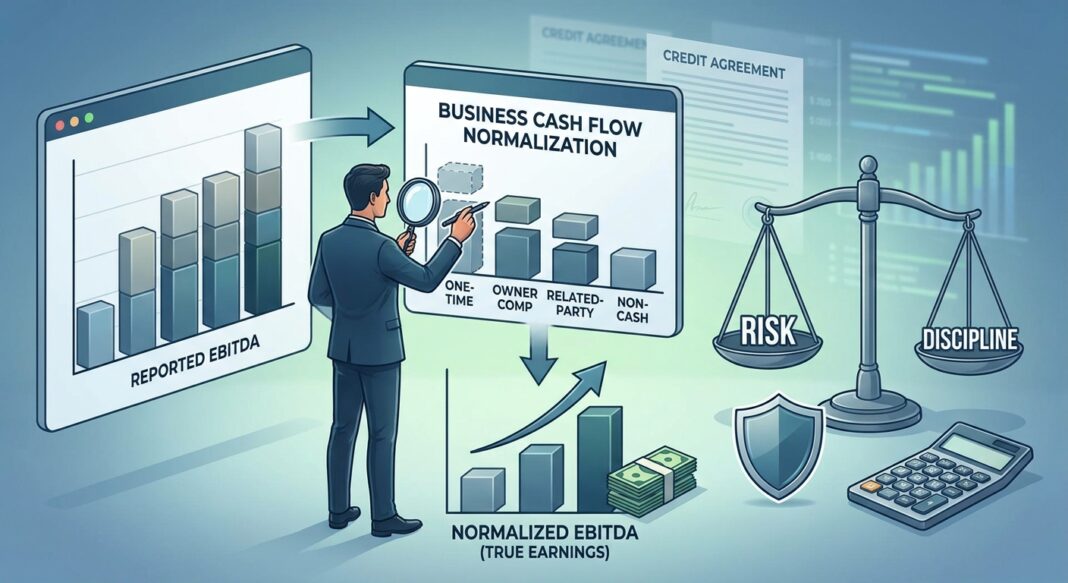
The Underwriting Challenge: What Are You Actually Lending Against?
A middle-market sponsor submits a CIM showing $10.2M in Adjusted EBITDA for a manufacturing business. The reported EBITDA is $7.1M. The $3.1M gap, a 44% uplift, is supported by a two-page schedule of add-backs that includes management fees, a one-time ERP implementation, restructuring costs, and a CEO transition. The sponsor’s leverage ask is 4.5x. Before a single dollar of commitment is made, a disciplined lender must answer one foundational question: Which dollars of that $10.2M will actually be available to service debt after closing?
EBITDA normalization is not an accounting exercise. It is the first and most consequential act of credit underwriting. Every leverage ratio, every coverage covenant, and every stress scenario in the credit model flows from the EBITDA baseline a lender accepts. Getting it wrong, accepting inflated add-backs under competitive deal pressure, is how lenders underwrite into stressed credits that look healthy on paper until they aren’t.
This article teaches the normalization framework systematically: the analytical methodology, category-by-category mechanics, a worked example on a $10M EBITDA company, key metrics and thresholds, institutional red flags, credit performance context, and a step-by-step diligence checklist.
The Normalization Framework: From Reported to Lender-Accepted EBITDA
EBITDA normalization sits at the intersection of accounting analysis and credit judgment. The goal is to arrive at a sustainable, recurring cash earnings figure that will persist through the debt repayment period: not the earnings peak, not a management projection, not a synergy case.
Experienced lenders distinguish between two closely related but meaningfully different concepts:
- Adjusted EBITDA: The bridge from reported financials to a cleaned-up earnings number after removing one-time and non-operating items.
- Normalized EBITDA: A further refinement that reflects the earnings a buyer can sustainably underwrite after considering steady-state staffing, market-rate compensation, and necessary reinvestment costs under new ownership.
Normalized EBITDA can (and frequently does) come in lower than Adjusted EBITDA when the business requires additional costs under new ownership to sustain performance. The lender’s job is to reach the normalized figure, not the seller’s best case.
The Four Accepted Add-Back Categories
Institutional lenders and quality-of-earnings professionals organize add-backs into four defensible categories. Anything outside these categories is either discounted or rejected outright:
- Non-Recurring / One-Time Items: Legal settlements, one-off litigation, ERP implementations, CEO transitions, natural disaster costs: expenses that are genuinely historical, documented, and non-repeating. The test: will this cost recur? If honest analysis says “probably,” it should not be added back.
- Owner Compensation Normalization: Excess owner salary above market replacement cost, owner perks (personal vehicles, family travel, non-working family member payroll), and discretionary personal expenses run through P&L. These are the largest dollar category on most lower middle-market deals.
- Related-Party Transaction Normalization: Below-market or above-market rent paid to owner-affiliated entities, management fees paid to a sponsor, and intercompany charges that do not reflect arm’s-length economics.
- Non-Cash or Non-Operating Items: Stock-based compensation (with important caveats: see red flags), earnout liabilities, unrealized gains/losses, and accounting adjustments that do not represent real cash movement.
The decisive standard is traceability and reasonableness: can the adjustment be traced to source documents? Is the rationale clear and documented? Would the cost truly disappear under new ownership and at what level?
The Analysis: Walking Through a $10M EBITDA Manufacturing Company
Consider a sponsor-backed industrial manufacturer with the following seller-presented earnings bridge:
| Line Item | Seller’s Claim ($000s) | Lender’s Assessment ($000s) |
|---|---|---|
| Reported EBITDA (LTM) | $7,100 | $7,100 |
| + ERP System Implementation (one-time) | $450 | $450 ✓ (documented) |
| + CEO Transition & Severance | $320 | $320 ✓ (verified non-recurring) |
| + Owner Compensation Above Market | $850 | $600 ⚠ (partial: market rate replacement budgeted at $250K) |
| + Restructuring Charges (“one-time”) | $780 | $390 ⚠ (recurring pattern, 3 consecutive years) |
| + Management Fee (sponsor add-back) | $400 | $400 ✓ (standard; ceases at close) |
| + Pro Forma Cost Savings (forward-looking) | $300 | $0 ✗ (speculative; not yet realized) |
| Adjusted / Normalized EBITDA | $10,200 | $9,260 |
The lender’s accepted EBITDA of $9.26M: $940K below the seller’s claim, is not a minor adjustment. At a 4.5x leverage ask, total debt capacity drops from $45.9M (seller’s basis) to $41.7M (lender’s basis), a $4.2M difference in commitment size that directly affects deal economics and sponsor returns.
Key Metrics and Coverage Calculations
With normalized EBITDA established, the lender calculates the primary credit metrics:
- Total Leverage: Total Debt ÷ Normalized EBITDA → $41.7M ÷ $9.26M = 4.5x
- Interest Coverage: Normalized EBITDA ÷ Cash Interest (est. $2.5M at ~6%) = 3.7x
- Fixed Charge Coverage Ratio (FCCR): (EBITDA – CapEx – Cash Taxes) ÷ (Cash Interest + Scheduled Amortization) = ($9.26M – $1.2M – $0.8M) ÷ ($2.5M + $1.5M) = 1.69x
This FCCR of 1.69x clears the institutional minimum comfortably. Lenders typically set FCCR covenant floors between 1.0x and 1.25x in credit agreements, with a common private equity transaction benchmark near 1.2x. A declining FCCR trend over consecutive quarters is a leading indicator of stress warranting active portfolio monitoring.
Industry Standards: What Institutional Lenders Look For, and the Data That Supports Discipline
The Add-Back Gap Problem
The distance between seller-presented and lender-accepted EBITDA has become a defining feature of the current deal environment. The bridge between reported and adjusted EBITDA is no longer just a negotiating convention; it is a material credit risk. In today’s deal environment, buyers and lenders are not rejecting add-backs outright, but they are testing them with sharply increased rigor. Aggressive or loosely documented add-backs are less likely to survive a quality-of-earnings review. For companies in the $5M–$75M revenue range, adjustments need to be supported by records, logic, and consistency.
On any transaction above approximately $1M in EBITDA, institutional buyers and lenders commission an independent Quality of Earnings (QoE) report. The QoE analyst reconstructs adjusted EBITDA from primary source documents (bank statements, invoices, payroll records) not from the seller’s recast schedule. Every add-back is traced back to a primary document and tested for recurrence.
The Financing Discipline: Add-Backs Lenders Reject Hurt Debt Capacity Directly
The practical constraint on normalization inflation is direct and severe. Any add-back that lenders will not credit in their underwriting reduces the buyer’s available leverage, which either makes the deal uneconomic at the agreed price or forces a purchase price reduction to restore the target leverage ratio. A seller whose add-backs are rejected by the lender’s QoE team will face a buyer who cannot close the deal at the agreed price because the financing does not work at that EBITDA base.
Many PE buyers exclude stock-based compensation specifically when calculating debt capacity, because lenders underwriting leverage ratios (Debt/EBITDA) should not extend credit against earnings that are inflated by adding back genuine compensation costs.
Data Box: Credit Performance Context
Private Credit & Leveraged Loan Default and Recovery Data (2024–2026)
- Private credit default rate (2025): Estimated at 1.6%–4.7%, depending on whether distressed exchanges are included. Moody’s analysis shows that distressed restructurings accounted for approximately 65% of all defaults in 2025, materially influencing how default risk is measured across private markets. (Source: Moody’s Ratings, April 2026)
- Leveraged loan default rate (2025 projection): Moody’s projected the leveraged loan default rate to end 2025 at approximately 7.5%, rising to 7.9% in Q1 2026, nearly double the 3.4% historical average. (Source: Moody’s Credit Strategy Report, July 2025)
- First-lien recovery rates: S&P Global Ratings expects recovery rates on rated first-lien debt to be lower than historical averages, with empirical data showing notable degradation in recent periods. Moody’s has estimated expected ultimate recoveries on U.S. first-lien loans at roughly 68%, versus long-run historical experience in the high 70s. For base-case credit modeling, a 60%–70% first-lien recovery assumption is considered defensible; rating agencies apply 45%–60% in AAA stress scenarios. (Sources: S&P Global Ratings, March 2024; Moody’s Ultimate Recovery Database)
- Covenant structure and recovery correlation: S&P Global Ratings data shows that cov-lite loans realized average and median recovery rates that were 11% and 34%, respectively, below those realized by non-covenant-lite loans. Outside of oil & gas and retail sectors, recovery levels on loans with financial covenants outperformed those without by 26% on average and 40% at the median. (Source: S&P Global Ratings, October 2020)
- The add-back gap at closing: Add-backs in the average sale process now account for approximately 29% of adjusted EBITDA, and only 8% of companies have actual post-closing EBITDA that exceeds the management projections presented to buyers before signing. (Source: S&P Global research referenced in Ferdinand Partners analysis, 2026)
Common Red Flags in EBITDA Normalization
- “One-Time” Charges in Three Consecutive Years: Restructuring costs, integration expenses, or advisory fees that appear annually are operational costs, not non-recurring events. A pattern of recurring “one-time” items is a red flag that the business has structural issues being masked as exceptional charges.
- Pro Forma Cost Synergies Without Realized Evidence: Forward-looking cost savings, headcount reductions not yet executed, and price increases not yet reflected in revenue are synergies the buyer keeps, not earnings the lender should underwrite. The line between accepted and rejected add-backs is whether it describes historical, documented, non-recurring cash versus forward-looking, speculative cash.
- Stock-Based Compensation Add-Backs: SBC represents a real compensation cost. Adding it back inflates the earnings base against which leverage is calculated without reducing the actual cash burden on the business post-close.
- Owner Revenue Concentration Without Transition Plan: Founder-dependent revenues in a business where the owner is exiting represent an adjustment to earnings that may not survive. Revenue tied to personal relationships, referral networks, or owner-specific technical skills requires a documented retention and transition plan before any credit is given.
- Large Variances Between Reported and Adjusted EBITDA: The difference between reported EBITDA and adjusted EBITDA can legitimately reach 20%–50% in owner-operated businesses. Beyond that range, particularly when the bridge reaches 40%+, lenders should apply heightened scrutiny and confirm the post-closing run-rate with independent operating evidence: customer retention data, backlog, pricing history, utilization, and headcount.
The EBITDA Normalization Underwriting Checklist
Use this step-by-step diligence framework on every new credit with seller-adjusted EBITDA:
Step 1: Obtain and Reconstruct the Earnings Bridge
- Request a detailed add-back schedule tied to specific line items in the P&L, with fiscal year and period clearly identified for each adjustment.
- Require primary source documentation for every add-back above $50K: invoices, board resolutions, employment agreements, settlement agreements.
- Reconcile the adjusted EBITDA bridge independently back to the general ledger, do not rely on the seller’s recast as a starting point.
Step 2: Classify and Stress Every Add-Back
- Categorize each add-back: one-time item, owner comp normalization, related-party normalization, or non-cash item.
- Apply the recurrence test: does this cost appear in any form in prior years? If yes for two or more periods, treat it as ongoing.
- Apply the ownership test: will this cost exist, disappear, or change under the new owner’s cost structure? Budget the replacement cost and net it against the add-back.
- Reject all forward-looking or synergistic add-backs; request that they be modeled separately in an upside scenario, not in the base underwriting EBITDA.
Step 3: Validate Against Operating Metrics
- Cross-check normalized EBITDA margins against industry benchmarks and the company’s own 3–5 year historical margin trajectory.
- Evaluate whether EBITDA add-backs are truly non-recurring, whether margins are stable, whether working capital is sufficient, and whether recent performance can be reconciled to the general ledger, and compare financial results with customer retention, backlog, pricing, utilization, and headcount data.
- Request bank statements for the trailing 24 months to verify cash receipts and disbursements are consistent with the normalized earnings claim.
Step 4: Build the Credit Metrics on Lender-Accepted EBITDA
- Calculate Total Debt / Normalized EBITDA, Interest Coverage, and FCCR using the lender’s accepted figure, not the sponsor’s.
- Stress test FCCR at a 15%–20% EBITDA haircut and confirm it remains above the covenant floor (typically 1.0x–1.25x in the credit agreement).
- Size the commitment and set covenant levels from lender-accepted EBITDA only.
Documentation Requirements
- Three years of audited financial statements (or reviewed, at minimum, for companies under $5M EBITDA)
- Trailing twelve-month (LTM) management accounts with monthly P&L detail
- Detailed add-back schedule with source document references
- Independent QoE report from a recognized transaction advisory firm (Big 4, BDO, RSM, Grant Thornton, or equivalent)
- Customer concentration analysis: top 10 customers as a percentage of revenue and contract status
- Owner employment and transition agreement confirming post-close compensation structure
Key Questions to Ask Management
- “What is the market-rate replacement cost for the owner’s role, and is it budgeted in the go-forward model?”
- “Which of these restructuring charges, if any, will recur in the next 12 months?”
- “Are any revenue-generating relationships personally dependent on the seller?”
- “What maintenance CapEx level is required to sustain current revenue, and has it been deducted from the cash flow calculation?”
- “Has working capital been normalized for seasonal fluctuations, and is the peg appropriate for a debt service environment?”
Key Takeaways
- The EBITDA baseline is the underwriting decision. Every leverage multiple, coverage covenant, and stress scenario in a credit model flows from the normalized EBITDA a lender accepts. A $940K reduction in accepted EBITDA at 4.5x leverage is a $4.2M reduction in commitment size, a material difference in deal economics and risk exposure.
- Only historical, documented, non-recurring cash survives underwriting discipline. The line between an accepted and rejected add-back is whether it describes past, verified, non-repeating cost versus forward-looking, speculative, or synergistic benefit. Lenders who credit the latter underwrite against earnings they will never collect.
- The default and recovery data demand conservatism. With private credit default rates running between 1.6% and 4.7% in 2025 (including distressed exchanges) and first-lien recoveries declining toward 68% from historical high-70s levels, the margin for EBITDA error in leveraged structures is materially narrower than historical averages suggest.
- Covenant-lite structures degrade recovery outcomes. S&P Global Ratings empirical data shows cov-lite first-lien loans recover 11%–34% less than loans with financial maintenance covenants. Tight maintenance covenants (particularly a leverage test and FCCR floor) are not bureaucratic constraints; they are recovery-rate tools that give lenders early engagement rights when performance deteriorates.
- Post-closing EBITDA rarely meets the management case. Only 8% of companies deliver post-closing EBITDA above the management projections presented at signing. Conservative normalization, documented operating evidence, and stress-tested coverage ratios are the structural defenses against a credit outcome determined by over-optimistic underwriting.


