
Underwriting & Risk Management | Bond Capital
EBITDA Adjustments and Normalization: The Lender’s Discipline for Defensible Underwriting
November 9, 2026
The $3 Million Question Every Credit Committee Must Ask
A sponsor submits a Confidential Information Memorandum for a $60 million unitranche financing on a precision manufacturing business. The CIM proudly headlines $12.3 million in Adjusted EBITDA: a clean 4.9x leverage multiple that clears most direct lending thresholds on the surface. But buried in the add-back schedule are $1.1 million in “one-time” ERP implementation costs (repeated for the third year in a row), $800K in management fees to a related party, $620K in stock-based compensation, and $490K in “synergies” expected from a distribution contract signed two weeks before LOI. Strip those away, and underwriting EBITDA lands closer to $9.2 million, a 6.5x leverage ratio that tells an entirely different credit story.
This gap between reported, adjusted, and normalized EBITDA is the single most consequential variable in leveraged credit underwriting. It controls leverage ratios, debt service coverage calculations, covenant headroom, and, ultimately, whether a lender gets repaid. As one practitioner framework makes clear, every dollar of inflated or unjustified Adjusted EBITDA has a disproportionate impact on valuation and deal returns when multiplied across an enterprise value calculation. The discipline required to close that gap is not a negotiating tactic. It is the foundation of sound credit risk management.
This article provides Bond Capital’s analytical framework for decomposing, stress-testing, and defending a normalized EBITDA figure: with a worked example, key metrics, institutional standards, and a diligence checklist.
The Three-Tier EBITDA Framework
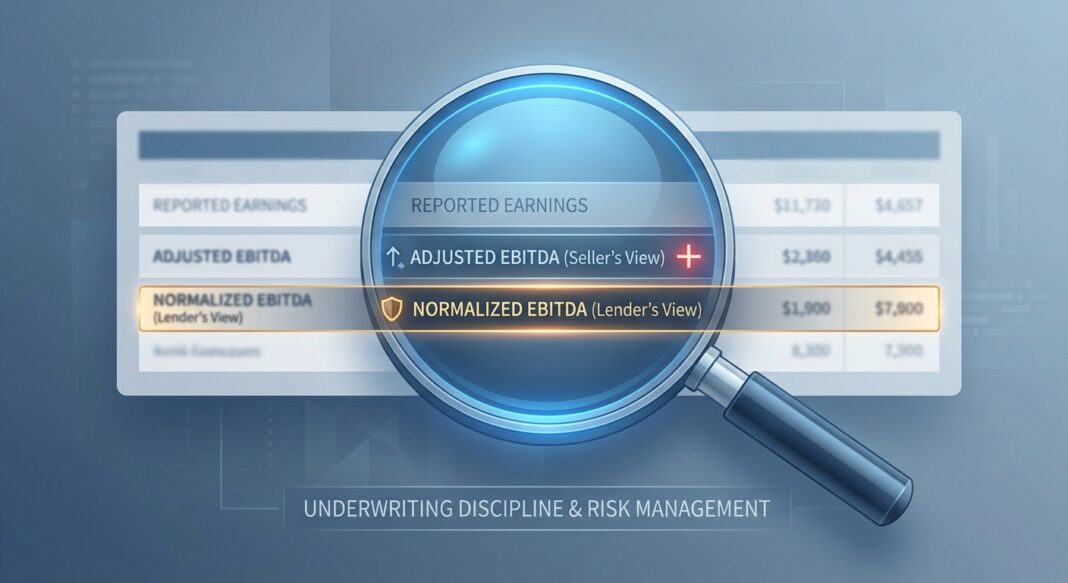
Experienced lenders distinguish between three distinct EBITDA figures, each serving a different analytical purpose:
- Reported EBITDA: The earnings figure derived directly from audited or reviewed financial statements before any adjustments. This is the anchor, the number the lender can verify independently.
- Adjusted EBITDA: The seller’s or sponsor’s version, reflecting all proposed add-backs including one-time items, owner-specific costs, and pro forma items. This is the starting point, not the conclusion. As credit practitioners consistently note, seller-provided schedules are viewed as a starting point, not a conclusion, lenders independently evaluate each adjustment for reasonableness, documentation, and sustainability.
- Normalized EBITDA: The figure the lender actually underwrites: the earnings a buyer believes will survive after closing under steady-state operations, fully staffed management, market-rate compensation, and no further benefit from one-time items. Normalized EBITDA is the sustainable earnings base lenders try to underwrite, not simply the seller’s highest adjusted EBITDA presentation.
The practical formula is straightforward but the judgment required is substantial:
Normalized EBITDA = Reported EBITDA + Accepted Add-Backs − Required Downward Adjustments
Critically, not all adjustments run in the same direction. Buyers and lenders sometimes make downward adjustments to remove one-time revenue or non-recurring income that inflated the seller’s trailing results, reducing adjusted EBITDA below the reported figure. An overpaid owner whose compensation is adjusted downward adds to EBITDA; an underfunded management team that needs market-rate hires reduces it.
Worked Example: $10M EBITDA Precision Manufacturing Company
Consider a hypothetical bolt-on acquisition in industrial distribution. The seller presents the following bridge:
| Line Item | Amount | Lender’s Assessment | Credit? |
|---|---|---|---|
| Reported EBITDA (LTM) | $8,400,000 | Verified from reviewed financials | ✓ Full |
| Add-Back: Owner excess comp above market | $650,000 | Supported by BLS comp benchmarks; replacement CEO budgeted at market rate | ✓ Full |
| Add-Back: One-time legal settlement | $380,000 | Board-approved, no recurring exposure; documented via legal counsel letter | ✓ Full |
| Add-Back: ERP implementation costs | $520,000 | Recurring 3 years; treated as ongoing capex by lender | ✗ Rejected |
| Add-Back: Stock-based compensation | $310,000 | Treated as real economic cost; excluded per sponsor practice | ✗ Rejected |
| Add-Back: Pro forma synergy (distribution contract) | $490,000 | Signed 2 weeks pre-LOI; no revenue recognized; no realization schedule | ✗ Rejected |
| Downward Adjustment: Below-market rent to related party | ($180,000) | Facility lease to owner’s LLC at 40% of market; cost normalized to market | ↓ Applied |
| Lender’s Normalized EBITDA | $9,270,000 | vs. Sponsor’s $10,750,000 Adjusted EBITDA | ↓ $1.48M gap |
At a $60M debt request: the sponsor’s adjusted EBITDA implies 5.6x leverage; the lender’s normalized EBITDA implies 6.5x leverage: a one full turn of incremental leverage risk that changes both the credit approval decision and covenant structure.
From Normalized EBITDA to Credit Metrics: The Calculations That Matter
Once a defensible normalized EBITDA is established, lenders build the primary credit metrics that govern both the initial underwriting decision and ongoing covenant compliance. The three most critical ratios in middle-market direct lending are:
1. Total Leverage Ratio (Debt / EBITDA)
Lenders underwrite acquisition financing based on Debt/EBITDA ratios, and inflated normalized EBITDA that lenders do not accept in their own underwriting does not support the debt capacity needed to achieve target returns. In the middle market, senior debt sizing typically runs 3.0x to 4.5x normalized EBITDA for unitranche structures, with total leverage in sponsored deals reaching 5.0x–6.0x inclusive of subordinated tranches. At 6.5x on our example, a covenant triggering at 6.75x total leverage leaves less than $2.5M of EBITDA cushion before breach, a razor-thin margin in a manufacturing business exposed to input cost volatility.
2. Debt Service Coverage Ratio (DSCR)
DSCR measures how much cash flow is available to cover loan payments and is typically calculated using normalized cash flow after accounting for taxes, working capital needs, maintenance capex, and scheduled debt service. A standard institutional lender covenant sets a minimum DSCR of 1.10x–1.25x. In our example, with $60M in debt at SOFR + 450bps (approximately 9.8% all-in at current rates), annual cash interest runs ~$5.9M. At $9.27M normalized EBITDA, less $1.2M maintenance capex, less $800K taxes, free cash flow is approximately $7.27M, yielding a DSCR of 1.23x, which sits at the edge of typical covenant thresholds. If EBITDA overstatement had been accepted and synergies credited, apparent DSCR would have been 1.45x, a materially different risk picture. Overly aggressive EBITDA normalization can make DSCR appear acceptable on paper but fail during underwriting.
3. Stress-Tested EBITDA and Downside Scenario
Institutional credit committees require a downside scenario, typically a 20–30% EBITDA haircut applied to normalized (not adjusted) earnings. In our example: a 25% stress haircut on $9.27M produces a stress EBITDA of $6.95M, implying stressed leverage of 8.6x and stressed DSCR of 0.86x, a covenant breach in virtually any structure. This is precisely the scenario stress testing is designed to reveal before deployment, not after.
What Institutional Lenders Require: Standards, Benchmarks, and Market Data
Evolving Market Standards on Add-Backs (2025–2026)
The credit market has meaningfully tightened its tolerance for aggressive add-back practices. The 2025 Federal Reserve Senior Loan Officer Survey reported senior debt covenants tightening through 2025 as the credit cycle matured, forcing sponsors to underwrite tighter Adjusted EBITDA definitions. Sponsor LOIs in the lower middle market in 2026 routinely exclude all stock-based compensation add-backs, where in 2021 SBC add-backs were standard. Lenders now permit specific add-back categories with caps: management fees, board-approved restructuring charges with realization-period limits, and a limited synergy basket usually capped at 20 to 25 percent of unadjusted EBITDA.
Credit committees now flag deals where a high percentage of EBITDA comes from run-rate or non-cash add-backs, treating that dependence as credit risk rather than financial engineering. The specific threshold widely cited: if more than 25% of EBITDA comprises run-rate savings and non-cash add-backs, independent validation is required, and if unavailable, the underwriting EBITDA is haircut for covenant setting.
Synergy add-backs have also come under structural discipline. Purchase agreements increasingly permit pro forma synergies in covenant calculations only if they are realized within 18 months of closing, with documentation reviewed by an independent accounting firm.
Why Normalization Rigor Directly Impacts Recovery
The credit cost of undisciplined normalization materializes at default. According to the Cliffwater Direct Lending Index Loss Study (Q4 2024), private credit in the direct lending universe posted a 2024 default rate of 2.78%, with a loss-given-default of 36.4% and a recovery rate of 63.6%. By contrast, broadly syndicated loan (BSL) first-lien recovery in 2024 was 49.2%, according to the same study citing Moody’s data. Private credit reports higher recovery than BSL in part because smaller club deals enable faster, less litigious workouts, but only when original underwriting was conservative enough to preserve collateral value at the time of distress.
📊 Credit Performance Data Box
- Private Credit Default Rate (2024): 2.78%, Cliffwater Direct Lending Index, Q4 2024 Loss Study
- Private Credit Recovery Rate (2024): 63.6% vs. 49.2% for broadly syndicated first-lien loans, Cliffwater / Moody’s
- Cliffwater CDLI Annualized Loss Rate (2017–2025): ~1.47% for senior direct lending, Morgan Stanley / Cliffwater CDLI-S
- High-Yield Default Rate: S&P reported a trailing 12-month high-yield default rate above 4% through September 2025, near long-term averages (~4.5%)
- Moody’s Private Credit Default Range (2025): 1.6%–4.7%, depending on inclusion of distressed exchanges, with distressed restructurings accounting for approximately 65% of all defaults in 2025
- Lower Middle Market Default Rate (KBRA Forecast): Expected to reach 3% by year-end 2025, driven by a growing pipeline of stressed borrowers
- Cov-Lite Share Decline: S&P LCD Q1 2026 reports cov-lite share dropped to 89%, the first decline since 2010, with maintenance covenants returning in approximately 12% of new LBO deals
Sources: Cliffwater Direct Lending Index Q4 2024 Loss Study; Moody’s U.S. Corporate Default Risk 2026; S&P Global Ratings; KBRA; Morgan Stanley; S&P LCD Q1 2026
Top Red Flags in EBITDA Add-Back Schedules
- 🔴 Recurring “one-time” items: Any cost labeled non-recurring that appears in two or more trailing periods should be treated as ongoing.
- 🔴 Synergies without realization schedules: Pro forma add-backs without a documented timeline, responsible party, and independent review are almost always rejected by institutional credit committees.
- 🔴 High add-back concentration: When adjusted EBITDA exceeds reported EBITDA by more than 25–30%, underwriters should independently retest every add-back rather than accepting the management schedule.
- 🔴 Stock-based compensation add-backs: The SEC, FASB, and most institutional lenders treat SBC as a real economic cost. In 2026, buyers underwriting against an Adjusted EBITDA that adds back SBC typically reduce the multiple by 0.5 to 1.0 turns to compensate.
- 🔴 Related-party transactions at non-market rates: Below-market rent, above-market management fees, or inter-company pricing require normalization to market, in both directions.
- 🔴 Measurement period manipulation: Sellers may cherry-pick LTM vs. run-rate periods. TTM/LTM EBITDA reflects the trailing or last twelve months; run-rate EBITDA estimates earnings based on current conditions that may not be fully reflected in the trailing period. Lenders should require both and reconcile the gap.
The Bond Capital EBITDA Normalization Diligence Checklist
A Quality of Earnings review commonly evaluates revenue recognition, customer concentration, revenue quality, gross margin trends, add-back support, reserves, accounting cutoffs, working-capital behavior, cash conversion, and the relationship between EBITDA and cash flow. The following checklist operationalizes that process for credit underwriting teams.
Phase 1: Document Collection
- ☐ 3 years of audited or reviewed financial statements (or CPA-compiled at minimum)
- ☐ LTM management accounts with month-by-month detail
- ☐ Management’s full add-back schedule with source documentation (invoices, board minutes, contracts)
- ☐ Third-party QoE report (sell-side or buy-side), required for transactions above $5M EBITDA
- ☐ Compensation benchmarking data (BLS OEWS or industry-specific salary surveys)
Phase 2: Add-Back Evaluation
- ☐ Classify every add-back as: (a) Accepted, (b) Partially accepted with haircut, or (c) Rejected
- ☐ Flag any item labeled “non-recurring” that appears in more than one fiscal year
- ☐ Independently verify owner compensation against market benchmarks; apply replacement cost logic
- ☐ Apply the 25% rule: if add-backs exceed 25% of reported EBITDA, require independent validation or apply a blanket haircut
- ☐ Exclude all SBC add-backs unless supported by a dual-EBITDA analysis and multiple sensitivity
- ☐ Apply synergy caps: credit only synergies with a documented 12–18 month realization schedule and independent accounting review
Phase 3: Downward Adjustment Screen
- ☐ Identify all related-party transactions and re-price to market (rent, management fees, intercompany services)
- ☐ Assess maintenance capex adequacy, underspending on capex inflates EBITDA without sustaining asset value
- ☐ Review working capital trends: declining receivables collections or inventory build may signal pull-forward of revenue
- ☐ Check for above-market revenue contracts expiring within the loan term
Phase 4: Metric Construction & Stress Testing
- ☐ Build the Normalized EBITDA bridge: Reported → Adjusted → Normalized with each step documented
- ☐ Calculate Total Leverage (Debt / Normalized EBITDA), Senior Leverage, and FCCR on normalized basis
- ☐ Run a 20% and 30% EBITDA stress scenario, confirm minimum DSCR and covenant headroom in each
- ☐ Set covenant EBITDA using normalized (never adjusted) earnings, with no credit for unrealized synergies
- ☐ Document the gap between sponsor Adjusted EBITDA and lender Normalized EBITDA in the credit memorandum
Key Takeaways for Credit Underwriters
- Normalized EBITDA is not a negotiation; it is a risk management output. The lender’s obligation is to build an independent, evidence-based earnings figure. Proper normalization builds lender confidence, supports realistic valuations, and reduces the risk of unpleasant surprises during underwriting or after closing.
- The add-back schedule is where credit losses originate. Every inflated dollar compounds through leverage ratios, coverage calculations, and covenant structures. An inflated normalized EBITDA that lenders do not accept in their own underwriting does not support the debt capacity needed to achieve target returns.
- Apply the 25% threshold rigorously. When add-backs exceed 25% of reported EBITDA, the risk is no longer financial modeling; it is credit impairment waiting for a market downturn. Require independent validation or apply a portfolio-level haircut.
- Stress test from normalized EBITDA, never from adjusted EBITDA. Running downside scenarios from an inflated base produces false comfort. A 25% haircut from the sponsor’s adjusted EBITDA may still leave leverage above a trigger level that a 25% haircut from normalized EBITDA would breach, revealing the true risk.
- Recovery rates reward underwriting discipline. Private credit’s 63.6% recovery rate versus 49.2% for broadly syndicated loans is not structural luck; it reflects the tighter documentation, covenant protections, and closer lender-borrower relationships that begin at origination with a disciplined normalization process. The market’s return to maintenance covenants in 12% of new LBO deals in 2025–2026 signals that the credit cycle is rewarding, not penalizing, underwriting rigor.


