
Underwriting & Risk Management
EBITDA Adjustments and Normalization: The Credit Underwriter’s Most Contested Battleground
When a borrower presents $12M in adjusted EBITDA and a lender independently underwrites $9M, that $3M gap is not a rounding error; it is the difference between a fundable credit and a structurally impaired one. Master the full methodology for challenging, auditing, and normalizing EBITDA in private credit underwriting.
The Underwriting Challenge: Why the EBITDA You Receive Is Never the EBITDA You Should Use
Every credit memorandum starts with a headline earnings number. And in virtually every leveraged finance or private credit transaction, that number has been assembled, curated, and, in many cases, optimistically engineered by the borrower or their advisor. For lenders, the operative question is never “What does the borrower say they earn?” It is always “What do they actually, repeatably earn, and can that cash flow credibly service debt?”
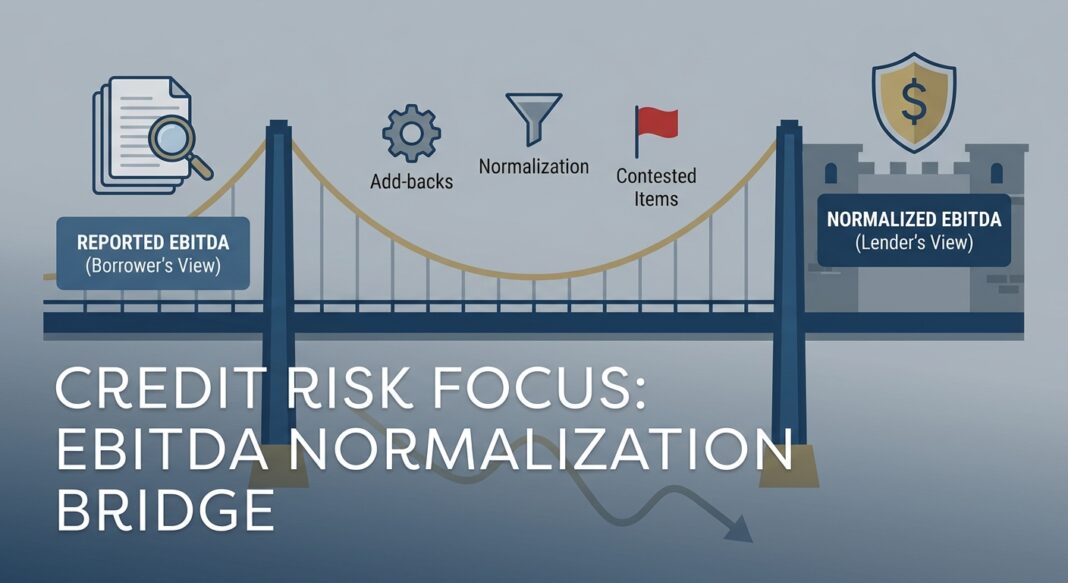
The distinction between reported EBITDA, adjusted EBITDA, and normalized EBITDA sits at the very center of credit risk. Reported EBITDA is simply the GAAP earnings figure before adding back interest, taxes, depreciation, and amortization. Adjusted EBITDA is management’s first pass at add-backs, removing what they characterize as non-recurring or non-operational costs. Normalized EBITDA, by contrast, is the figure a lender independently arrives at after testing every adjustment for evidence, repeatability, and operational integrity.
These three numbers are rarely identical. In practice, due diligence teams regularly find a 20% to 40% discrepancy between a seller’s initial marketing EBITDA and the sustainable earnings that survive independent verification. At a 5x leverage multiple on a $10M credit, a $2M EBITDA haircut is a $10M structural error: one that erodes debt service coverage, violates financial covenants, and creates impairment risk from day one.
This article provides the analytical framework, step-by-step methodology, and red-flag checklist that experienced credit underwriters use to independently assess and defend a normalized EBITDA figure, before the first dollar is committed.
The Analytical Framework: Building a Lender-Defensible EBITDA Bridge
A rigorous EBITDA normalization process is not a mechanical accounting exercise; it is an independent reconstruction of a company’s sustainable operating earnings. Lenders treat seller-provided schedules as a starting point, not a conclusion; the underwriter’s job is to stress-test every line in the bridge.
The Four-Layer EBITDA Bridge
A sound underwriting methodology works through four sequential layers, each applied with increasing scrutiny:
- Layer 1, Reported EBITDA: Begin with audited or reviewed financial statements, never tax returns or internal management accounts. The starting point must be GAAP-compliant and third-party verified. Apply this to three full trailing fiscal years plus the most recent trailing twelve months (TTM).
- Layer 2, Standard Add-Backs (Non-Cash Items): Reinstate depreciation, amortization, stock-based compensation, and other non-cash charges. These are universally accepted and rarely contested, but lenders should confirm that D&A treatment is consistent across periods and not being manipulated to smooth earnings.
- Layer 3, Non-Recurring and Extraordinary Item Adjustments: This is where the real work begins. Common categories include: one-time litigation settlements, M&A transaction fees, restructuring charges, facility relocation costs, one-time write-downs, and COVID-era disruptions. The lender’s task is to demand documentary support (invoices, legal agreements, board minutes) for every claimed non-recurring item. Any expense that appears in multiple years fails the non-recurring test by definition.
- Layer 4, Pro Forma and Run-Rate Adjustments: The most contested layer. Borrowers frequently include cost synergies not yet realized, management compensation normalization, revenue from recently signed contracts not yet in-period, and EBITDA contributions from recently acquired entities. Lenders should apply a high evidentiary standard: adjustments must be already realized or supported by binding agreements, not speculative projections.
Working Example: $10M EBITDA Manufacturing Company
Consider a middle-market industrial manufacturer presenting $10.2M in adjusted EBITDA to support a $45M leveraged buyout with $30M in senior secured debt (3.0x leverage).
| EBITDA Bridge Component | Borrower’s Claim | Lender’s Assessment | Variance |
|---|---|---|---|
| Reported EBITDA (TTM Audited) | $7.8M | $7.8M | – |
| Add: D&A & Non-Cash Items | $0.9M | $0.9M | – |
| Add: One-Time Legal Settlement (Year 3) | $0.6M | $0.3M (partial, recurring risk) | ($0.3M) |
| Add: Owner Compensation Normalization | $0.7M | $0.4M (replacement cost required) | ($0.3M) |
| Add: Pro Forma Contract Revenue (Not Yet Booked) | $0.8M | $0.0M (no binding agreement) | ($0.8M) |
| Add: Cost Savings Synergies | $0.4M | $0.0M (not yet realized) | ($0.4M) |
| Normalized EBITDA | $10.2M | $8.4M | ($1.8M) |
At a $30M debt load, the lender-normalized leverage ratio is 3.57x, not the 2.94x the borrower presented. At a 1.2x DSCR floor, this company requires approximately $2.5M in annual free cash flow to service debt; the normalized figure provides materially less headroom than the adjusted presentation implied.
The Analysis: Connecting Normalized EBITDA to Credit Metrics
Once a defensible normalized EBITDA is established, underwriters must translate that figure into the core credit metrics that govern deal structure, covenant thresholds, and stress capacity.
Core Credit Metrics: Definitions and Thresholds
- Total Leverage (Debt / Normalized EBITDA): The primary sizing metric. Middle-market direct lenders typically cap senior leverage at 3.5x–4.5x depending on sector, cashflow predictability, and asset coverage. Cyclical or capital-intensive businesses merit tighter caps.
- Interest Coverage (Normalized EBITDA / Cash Interest Expense): Measures the cushion against a debt service failure. Institutional lenders generally require a minimum of 2.0x on a trailing basis; 1.5x is often the covenant trigger level. In floating-rate environments, underwriters should stress-test coverage at base rate + 200bps to model a rate shock scenario.
- Debt Service Coverage Ratio (DSCR): (Normalized EBITDA – CapEx – Taxes – Working Capital) / (Cash Interest + Amortization). A DSCR below 1.1x signals acute refinancing risk. For acquisition financing, many lenders require a DSCR of at least 1.25x at close.
- Fixed Charge Coverage Ratio (FCCR): Broader than DSCR, FCCR incorporates all fixed obligations including operating leases, mandatory debt amortization, and scheduled capex. A covenant-level FCCR of 1.10x–1.20x is standard in middle-market credit agreements.
Stress Scenario: 20% EBITDA Haircut
Applying a standard recession-scenario 20% EBITDA stress to the normalized figure of $8.4M in our example reduces earnings to $6.7M. At that level, a $30M debt load at 7.5% all-in rate produces approximately $2.25M in annual interest, consuming nearly 34% of stressed EBITDA in interest alone: before CapEx, taxes, and amortization. This stress test transforms what looked like an acceptable credit at close into a covenant-breach candidate within 18 months of an economic downturn.
Industry Standards: What Institutional Lenders Look For, And What the Data Shows
Institutional credit practitioners have sharpened their normalization standards significantly in the post-2022 rate environment. Several converging forces explain the tightening:
- Lenders are independently validating every add-back. Lenders commonly apply caps on pro forma cost savings and synergy add-backs, typically no more than 15–25% of trailing EBITDA, and resist any adjustment that cannot be documented to the general ledger, payroll system, or binding contract. Adjustments must be evidence-based and tied to invoices, payroll records, and contracts; hypothetical cost cuts or best-case outcomes are routinely rejected.
- “Recurring one-time” items are a systemic red flag. When similar restructuring charges, legal costs, or personnel expenses appear across two or more fiscal years in a seller’s schedule, they fail the non-recurring test. A sound underwriting rule: any expense appearing in 3 of 5 years is an operating cost, not an add-back.
- LPs and regulators are demanding greater transparency. Limited partners at private equity and private credit funds are demanding further transparency, and lenders are tightening underwriting standards in response. The gap between marketing EBITDA and lender-accepted EBITDA has become a formal risk factor in credit committee discussions at institutional shops.
Credit Performance Data: What Happens When EBITDA Is Misjudged
📊 Data Box: Default, Recovery, and Stress Data (2024–2025)
- Private Credit Default Rate (2025): Moody’s estimates the private credit default rate ranged between 1.6% and 4.7% in 2025, depending on whether distressed exchanges are included, a materially wide band that reflects ongoing uncertainty in EBITDA-based underwriting quality across the asset class.
- Distressed Exchanges as a Share of Defaults: Approximately 65% of all corporate defaults in 2025 were distressed restructurings (workouts, indenture modifications, and debt-for-equity swaps) rather than hard payment defaults. This signals that most credit deterioration is originating in overleveraged structures underwritten to overstated earnings bases, not acute liquidity events.
- First-Lien Senior Secured Loan Recoveries: First-lien senior secured loans have historically recovered roughly 70–80 cents on the dollar, but recent expected recoveries have drifted down toward 60–70%, driven in part by loan-only capital structures with little junior cushion to absorb losses. S&P Global data shows average discounted loan recoveries for 2022–2023 fell to approximately 61.5%, nearly 12 percentage points below the long-term average, partly reflecting the weakening of loan structures in prior deal cycles.
- High-Yield Default Rate Projection: High-yield bond issuers are projected to see a realized default rate of approximately 3.2% for calendar year 2025, with Moody’s projecting a rise above 4% by Q1 2026, still below the 4.5% historical average since 1996, but a meaningful uptick from the benign 2021–2022 environment when aggressive EBITDA underwriting was widespread.
- Direct Lending Market Scale: Private credit corporate lending assets under management are expected to exceed $2 trillion in 2026, growing toward $4 trillion by the end of the decade. At this scale, systemic weaknesses in EBITDA normalization methodology are not firm-level issues; they are market-level risks.
Common Mistakes in Lender EBITDA Analysis
- Accepting management-presented schedules without mapping every add-back to the general ledger
- Applying synergy add-backs before operational integration is confirmed with binding evidence
- Failing to stress-test interest coverage at current floating-rate levels plus a shock scenario
- Ignoring working capital seasonality, which can distort TTM EBITDA in capital-light businesses
- Treating owner compensation normalization as a simple market-rate substitution without accounting for replacement hire cost, transition risk, and key-man dependency
The EBITDA Normalization Underwriting Checklist
Use this step-by-step diligence framework before finalizing any EBITDA-based credit metric in a deal memo or credit committee presentation.
✅ Source Document Verification
- Obtain three full years of audited or reviewed financial statements, do not accept tax returns as the primary source
- Build all EBITDA analysis from GAAP-compliant financials; reconcile to the general ledger for any contested line items
- Request monthly management accounts to identify seasonality, revenue lumping, or mid-year cost deferral patterns
✅ Add-Back Audit Protocol
- Require documentation for every proposed add-back exceeding $50,000: invoices, contracts, legal filings, board minutes
- Test each add-back against the “3-in-5 rule”: any cost appearing in 3 of the past 5 years is recurring by definition
- Apply a cap on total pro forma and synergy adjustments, typically no more than 15–25% of reported EBITDA; require realized evidence for anything above that threshold
- For owner compensation add-backs: model the full replacement cost including benefits, equity, and transition risk, not just base salary
✅ Revenue Quality Tests
- Assess customer concentration: any single customer exceeding 20% of revenue is a concentration risk requiring explicit covenant protection
- Confirm revenue recognition methodology, accelerated recognition is a frequent source of inflated EBITDA in software and services businesses
- Review contract terms, renewal rates, and backlog to assess revenue visibility for the next 12–24 months
- Ask: Is any portion of in-period revenue attributable to a contract, customer, or event that will not recur?
✅ Cash Flow Bridge and Stress Test
- Bridge from normalized EBITDA to free cash flow: subtract maintenance CapEx, cash taxes, and working capital requirements
- Calculate DSCR and FCCR at normalized EBITDA, then at a 15% stress and a 25% downside scenario
- Stress-test interest coverage at current floating rate PLUS 200bps to model a rate shock environment
- Model the cash impact of a single customer loss scenario if concentration exceeds 15%
✅ Credit Metric Thresholds to Document in the Credit Memo
- Total Leverage (Debt / Normalized EBITDA): must be within sector-appropriate ceiling (typically 3.5x–4.5x for middle market senior secured)
- Interest Coverage (Normalized EBITDA / Cash Interest): minimum 2.0x at close; covenant trigger at 1.5x
- DSCR (post CapEx and taxes): minimum 1.25x at close; flag any deal below 1.10x for elevated monitoring
- Document the EBITDA delta between borrower-presented and lender-normalized figures; this delta must appear explicitly in the credit committee memo
Key Takeaways for Credit Underwriters
- The gap between adjusted and normalized EBITDA is a credit risk, not an accounting nuance. A borrower-presented EBITDA figure that cannot survive independent lender scrutiny inflates leverage ratios, understates credit risk, and sets up structural impairment at the first sign of operating stress.
- Every add-back is a hypothesis, underwriters must demand proof. Non-recurring items, cost savings, and pro forma revenue must be traceable to the general ledger, supported by binding documentation, and absent from prior-year filings. Anything less is an unsupported assumption embedded in your debt sizing.
- Recovery rates are declining, which means precise EBITDA underwriting matters more, not less. With first-lien senior secured loan recoveries drifting below historical averages toward 60–70 cents on the dollar, the margin for EBITDA error at origination has narrowed significantly. Lenders can no longer rely on collateral recovery to bail out weak underwriting.
- Stress-test before commitment, not after. Model a 20–25% EBITDA haircut at the time of underwriting and assess whether the credit can still service debt and avoid covenant breach. If it cannot, the structure, not the post-close monitoring process, needs to change.
- The EBITDA normalization delta must be disclosed in the credit memo. Institutional discipline requires transparency: the difference between what the borrower claimed and what the lender independently underwritten is a material credit fact, not a negotiating detail to be resolved in closing documents.


