
Underwriting & Risk Management, Bond Capital Research Desk
EBITDA Adjustments and Normalization: The Credit Underwriter’s Guide to Defensible Earnings
August 25, 2026
The Underwriting Challenge: When Earnings Are a Marketing Exercise
A sponsor-backed manufacturer presents a credit package with $10.2 million in Adjusted EBITDA. The reported EBITDA from audited financials? $6.8 million. The $3.4 million gap, a 50% premium, is composed of management consulting fees paid to a related party, one-time legal costs on a matter that has not yet been resolved, projected cost savings from a restructuring still underway, and pro forma revenue from a customer contract not yet signed. The deal memo calls it “highly conservative underwriting.”
This scenario is not a rare edge case. It is a defining challenge of private credit underwriting in 2025 and 2026. The bridge between reported and adjusted EBITDA has become one of the most contested (and most exploited) spaces in leveraged finance. For credit professionals at Bond Capital, accepting a borrower’s EBITDA schedule at face value is not underwriting. It is delegation of risk to the sell side.
This guide lays out a rigorous, step-by-step normalization methodology, anchored in how institutional lenders actually underwrite earnings quality, and calibrated against current default data that reveals what happens when add-backs are accepted uncritically.
The Framework: Building a Defensible Normalized EBITDA
The goal of EBITDA normalization is not to minimize earnings or to challenge every add-back on principle. The goal is to arrive at a sustainable, repeatable earnings base that a lender can underwrite with confidence across a range of operating scenarios. There is an important distinction between two related but different outputs:
- Adjusted EBITDA removes one-time and non-operating items from reported results. It is the starting point.
- Normalized EBITDA goes further: it reflects what the business will earn under steady-state ownership, incorporating market-rate replacements for below-cost expenses, appropriate management compensation, and only the cost savings already visible in the run rate.
As Windsor Drake’s practitioner guide notes, normalized EBITDA goes further to reflect the earnings a buyer can sustainably underwrite after considering steady-state staffing, market compensation, and necessary reinvestment.
Critically, normalized EBITDA can be lower than adjusted EBITDA when the business requires additional cost layers under a new ownership structure.
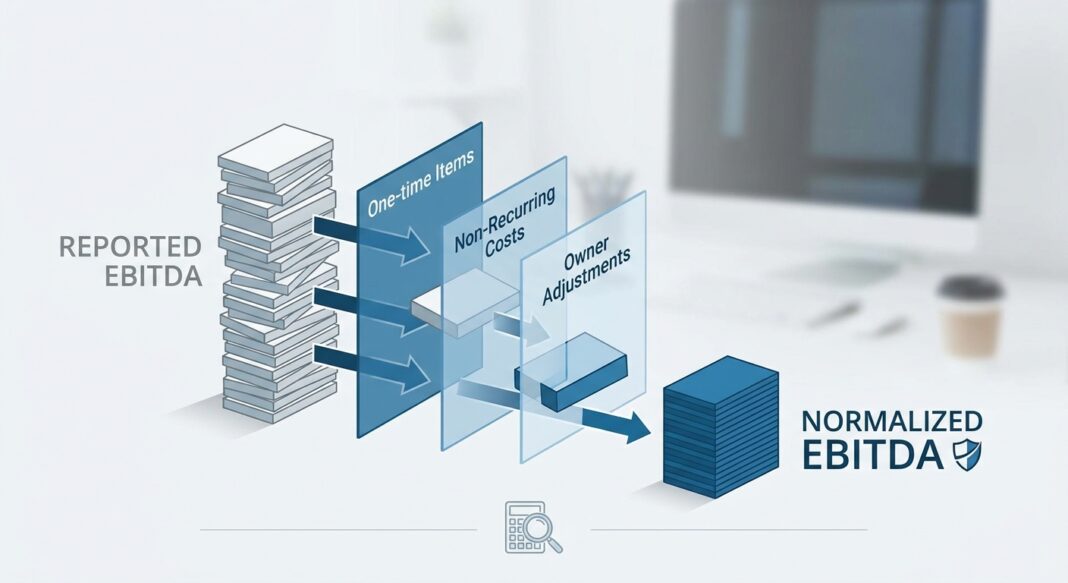
The Normalization Waterfall: Five Layers
- Layer 1, Start with LTM Reported EBITDA: Use the trailing twelve-month period, reviewed or audited, as the base. Lenders should independently pull this from financial statements, not from management’s compliance certificate.
- Layer 2, Apply Non-Recurring Adjustments: Remove items that are genuinely one-time and non-operational: resolved litigation settlements, one-time severance, transaction fees, natural disaster losses. Each must be documented and closed.
- Layer 3, Normalize Owner Economics: For founder-led businesses, adjust above-market owner compensation to a market replacement cost. Normalize related-party rent, management fees, and any personal expenses run through the P&L. Do not assume the full compensation delta without verifying a replacement hire is not already needed.
- Layer 4, Validate Run-Rate Adjustments: Credit only those cost savings or revenue improvements already visible in invoices, payroll records, and bank deposits. Pro forma synergies and anticipated savings that depend on post-closing actions should be excluded or haircut significantly.
- Layer 5, Apply a Lender Haircut: Even after rigorous adjustment, experienced underwriters apply a conservative haircut, typically 10%–15%, to arrive at the underwritten EBITDA used for leverage and coverage ratio calculations. This provides a structural margin of safety before covenants are even set.
Worked Example: $10M EBITDA Manufacturing Company
| Line Item | Amount | Lender Decision |
|---|---|---|
| LTM Reported EBITDA | $6,800,000 | Starting base |
| + One-time legal settlement (resolved, documented) | $400,000 | Accepted, full documentation |
| + Owner compensation above market | $350,000 | Accepted, replacement hire quoted |
| + Consulting fees (related-party, ongoing) | $600,000 | Rejected: recurring, related-party |
| + Restructuring savings (not yet realized) | $800,000 | Rejected: post-closing dependency |
| + Pro forma revenue (contract unsigned) | $1,250,000 | Rejected: not in run rate |
| = Lender-Underwritten Normalized EBITDA | $7,550,000 | Base for leverage/coverage |
| Less: 10% underwriting haircut | ($755,000) | Structural conservatism |
| = Underwritten EBITDA (Credit Base) | $6,795,000 | Final underwriting basis |
Note: Hypothetical illustration for educational purposes only. The sponsor’s marketing EBITDA of $10.2M is rejected at the lender level. The $3.4M gap, accepted at face value, would overstate leverage by nearly 50% and materially inflate debt capacity.
The Analysis: From Normalized EBITDA to Credit Metrics
Once a defensible EBITDA base is established, it drives every downstream credit metric. Here is how key ratios are affected by the normalization decision:
Leverage Ratio (Total Debt / EBITDA)
On the sponsor’s marketing EBITDA of $10.2M with $40M of total debt, the deal prices at 3.9x leverage: well inside most lender thresholds. On the lender-underwritten base of $6.8M, the same capital structure produces 5.9x leverage. That is a material difference in risk.
This is not a theoretical concern. S&P Global Ratings has found through multi-year cohort analysis that marketing EBITDA consistently overstates actual future performance. According to S&P’s analysis, EBITDA addbacks remain on an upward trend, with addbacks for deals originated in 2020 representing 31% of management projected EBITDA, and over 66% of last-12-month reported EBITDA
in large M&A and LBO transactions. The same analysis confirmed that actual leverage continues to fall significantly short of management projections,
with reported EBITDA coming in 36% below marketing EBITDA in follow-on years.
Debt Service Coverage Ratio (DSCR)
DSCR measures how comfortably normalized free cash flow covers interest and scheduled amortization. A minimum of 1.20x at underwriting is a common institutional floor; conservative lenders target 1.35x–1.50x to accommodate operating variance. If EBITDA normalization is overly aggressive, DSCR may appear compliant on paper but collapse under any real-world stress. The formula:
DSCR = Normalized EBITDA − Taxes − CapEx − Working Capital Changes
/ (Total Annual Debt Service)
Stress Testing
Run three scenarios off the normalized base (base, moderate stress (−10% EBITDA), and severe stress (−20% EBITDA)) while simultaneously modeling a +50 basis point rate increase on floating-rate obligations. The stress test does not need to produce covenant compliance at every level; it needs to show where the company breaks and whether that break point provides adequate early warning.
The current market data makes this non-negotiable: according to S&P Global, a mild stress scenario of a 10% EBITDA drop combined with a 50 basis point rate increase pushes over 25% of middle market firms below 1x interest coverage, signaling distress that turnaround advisors must preempt.
Industry Standards: What the Data Tells Experienced Lenders
The market backdrop for EBITDA discipline in 2025–2026 is unusually demanding. Understanding current credit performance data is essential context for every normalization decision a lender makes.
📈 Credit Performance Data Box (2025–2026)
- Private Credit Default Rate Range (2025): Moody’s estimates the private credit direct lending default rate ranged between 1.6% and 4.7% in 2025, depending on whether distressed exchanges are included. This wide band reflects the structural complexity of how stress is measured in the asset class.
- Distressed Restructurings as % of All Defaults: Distressed restructurings (debt exchanges and maturity extensions under duress) accounted for approximately 65% of all 2025 private credit defaults. These are often described as “soft credit events” that defer, rather than resolve, underlying leverage stress.
- Fitch Record High (April 2026): Fitch Ratings reported that the U.S. private credit default rate hit a record high of 6.0% in April 2026. Fitch also estimated that private-credit-backed corporate borrowers experienced a 9.2% default rate in 2025.
- Proskauer Default Index (Q1 2026): Proskauer’s Private Credit Default Index, tracking 697 loans totaling $189.2 billion, recorded a 2.73% default rate in Q1 2026, up from 1.84% just two quarters earlier.
- Middle Market Leverage Creep: S&P Global Ratings found that average leverage across its U.S. middle market credit estimate population hit 7.0x in 2024, with 20% of companies already below 1x EBITDA interest coverage, before any rate increases or EBITDA deterioration.
- Cliffwater Senior Secured Loss Rate: The Cliffwater Direct Lending Index (CDLI) tracks approximately $295 billion across 14,000 loans and records historical default losses of roughly 1% per year since 2004 inception. Senior secured portfolios tracked through the CDLI-S cut that loss rate to approximately 0.25% annually, reinforcing why collateral position and covenant structure matter at origination.
Red Flags Experienced Lenders Watch For
- The “Stacked Add-Back” Structure: When add-backs layer multiple categories, owner compensation + related-party fees + cost savings + pro forma revenue, simultaneously, each individually defensible adjustment compounds into an EBITDA number that bears little relationship to operating reality. A Federal Reserve Bank of St. Louis working paper found that covenants based on customized measures of EBITDA
hurt loan performance by worsening lead arrangers’ incentives to monitor borrowers and by hampering their ability to take timely corrective actions.
- Pro Forma Adjustments Without Cash Evidence: Any adjustment that cannot be traced to bank statements, payroll records, signed contracts, or audited line items should be rejected. Projected synergies, anticipated headcount reductions, and future pricing power are not EBITDA.
- EBITDA Caps on Covenant Baskets: Borrowers whose credit agreements permit EBITDA add-back caps expressed as a percentage of reported EBITDA create a self-referential loop where inflated EBITDA permits higher baskets, which permit more debt, which further inflates leverage risk. Lenders should impose hard caps in dollar terms or tie them to independently verified base EBITDA.
- Rising PIK Income at the Portfolio Level: An increase in payment-in-kind (PIK) income across a lender’s BDC or private credit portfolio is a systemic early warning signal that borrowers are struggling to service cash interest, a precursor to covenant breaches and restructurings.
- LTM vs. Run-Rate Divergence: When run-rate EBITDA significantly exceeds LTM EBITDA, dig into the delta. Is it a genuine business inflection with documented revenue? Or is it a management projection dressed as a trailing metric? The former may warrant partial credit; the latter should be excluded.
The Bond Capital EBITDA Normalization Diligence Checklist
Use this framework at initial underwriting and during annual covenant compliance review.
✅ Documentation Requirements
- Three years of audited or reviewed financial statements plus current LTM management accounts
- Monthly P&L for the trailing 24 months (reveals seasonality and trend)
- Full management add-back schedule with supporting documentation for each line item
- Copies of all related-party agreements (management fees, rent, consulting contracts)
- Payroll records and offer letters supporting compensation normalization claims
- Signed customer contracts for any revenue included in run-rate projections
- Legal counsel confirmation on “resolved” litigation items claimed as add-backs
✅ Analytical Steps
- Build an independent earnings bridge: start from audited net income, not management’s adjusted schedule
- Test each add-back against three criteria: (1) Is it truly non-recurring? (2) Is it documented? (3) Would it disappear under new ownership?
- Recalculate all leverage and coverage ratios using lender-underwritten EBITDA, never marketing EBITDA
- Run base, moderate stress (−10% EBITDA, +50bps rate), and severe stress (−20% EBITDA, +100bps rate) scenarios
- Verify that maintenance covenant headroom (typically 20%–30% above covenant level) is preserved under the moderate stress scenario
✅ Questions to Ask Management
- Which add-backs will definitively disappear on Day 1 post-closing, and can you provide written evidence?
- What is the replacement cost for the owner’s operating role if the owner exits within 18 months?
- Are any of the “one-time” costs categories that have recurred in prior years?
- What is the cash conversion rate of EBITDA, and what are the primary working capital drivers?
- Has the company ever been in covenant default or sought a waiver? If so, on what basis?
Key Takeaways for Credit Professionals
- ■ Sponsor EBITDA is a starting point, not a conclusion. Seller-prepared add-back schedules should be treated as a negotiating position, not a credit input. Lenders must independently reconstruct the earnings bridge from source documents.
- ■ The add-back gap has direct leverage consequences. S&P’s cohort analysis shows that marketing EBITDA for large LBO transactions has historically exceeded actual reported EBITDA by 36%–39% in the years following close. Every dollar of unjustified add-back at a 6x multiple costs $6 of underwritten debt capacity.
- ■ Normalized EBITDA and adjusted EBITDA are not the same thing. Normalization asks what the business will sustainably earn; adjustment asks what items to remove. A business that requires incremental management hires post-close may have a normalized EBITDA that is lower than its reported adjusted EBITDA.
- ■ Current default data demands conservatism. With Fitch reporting a record 6.0% private credit default rate in April 2026 and Proskauer’s index showing defaults rising from 1.84% to 2.73% in just two quarters, the cost of an aggressive EBITDA acceptance decision is not theoretical.
- ■ Structural safeguards belong in the covenant package. Hard dollar caps on EBITDA add-back baskets, independent lender EBITDA definitions in credit agreements, and maintenance covenants set against independently verified normalized EBITDA are the structural counterparts to rigorous upfront underwriting.


