
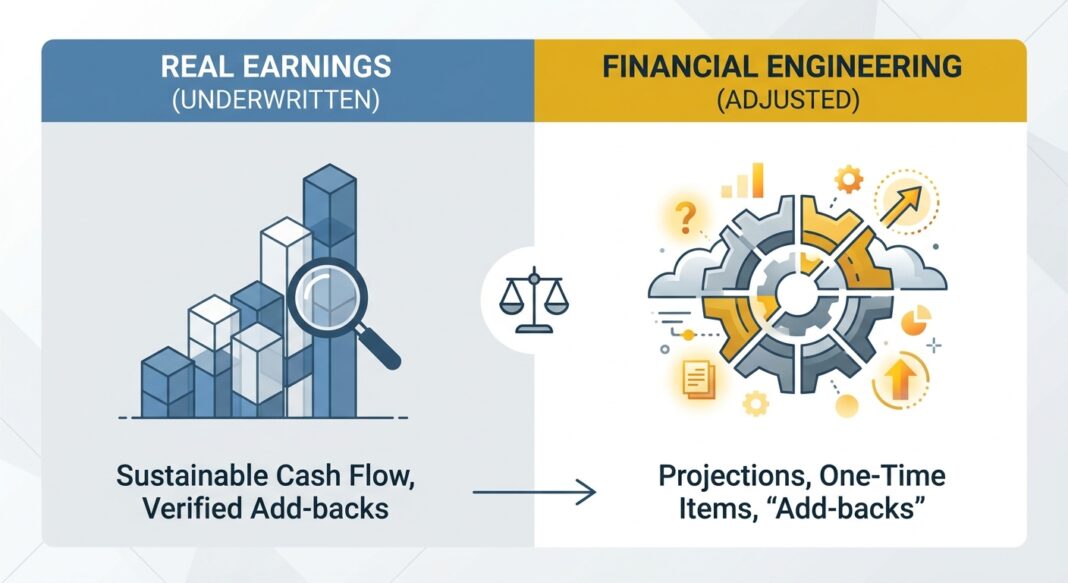
The Underwriting Challenge: When the EBITDA You Were Sold Isn’t the EBITDA You Own
A sponsor presents a $10M EBITDA manufacturing business. The Confidential Information Memorandum is clean. The management presentation is polished. And buried inside a 47-line adjustment schedule is $3.2M in add-backs: a mix of one-time legal costs, owner compensation normalization, synergy projections, and a COVID-era revenue disruption that hasn’t actually recurred in three years. Your proposed leverage is 5.0x. But if only $7.5M of that EBITDA is genuinely sustainable, you’ve already underwritten 6.7x debt-to-earnings, on a business that may not be able to service its debt through the first economic softening.
This is the core discipline of EBITDA normalization in credit underwriting: not accepting a seller’s earnings presentation as a starting point for valuation and leverage, but independently constructing the earnings a lender can actually underwrite. The stakes are structural. Every dollar of unjustified EBITDA adjustments inflates the leverage multiple, compresses the debt service cushion, and erodes loss recovery in a default scenario.
As conditions in private credit tighten post-2022, this discipline has sharpened considerably. Credit committees at direct lenders now treat high add-back concentrations as a standalone credit risk, not merely a financial engineering curiosity. Understanding how to dissect, rebuild, and stress-test a normalization schedule is a prerequisite skill for any lender operating in the middle market today.
The Framework: Building a Lender-Grade Normalization Schedule
EBITDA normalization and EBITDA adjustment are related but distinct concepts that any credit professional must distinguish. Adjusted EBITDA removes one-time and non-operating items from reported earnings to produce a cleaner historical earnings figure. Normalized EBITDA goes further: it reflects the sustainable earnings a buyer or lender can underwrite after considering steady-state staffing, market-rate compensation, and necessary ongoing reinvestment. Critically, normalized EBITDA can be lower than adjusted EBITDA when a business requires structural cost additions under new ownership.
For credit purposes, the relevant question is not what the business earned last year. It is: what will this business generate on a run-rate basis to service debt, maintain operations, and survive a moderate stress scenario?
The Four-Category Framework for Evaluating Add-backs
Experienced underwriters categorize every proposed adjustment into one of four buckets before accepting any credit to the EBITDA base:
- Category 1, Clearly Defensible: Documented, non-recurring, already resolved. Examples: one-time legal settlement with no ongoing exposure, transaction-related advisory fees, a natural disaster write-off. These survive diligence and receive full credit.
- Category 2, Conditionally Accepted: Factually supported but requiring independent verification. Examples: excess owner compensation above a documented market replacement cost; related-party rent normalized to arm’s-length market rates. These are accepted only with third-party evidence: comparable salary surveys, independent lease appraisals, or audited financials.
- Category 3, Discounted or Haircut: Adjustments that represent future savings not yet in the run rate, or operational improvements contingent on post-closing actions. Examples: announced but unimplemented headcount reductions, cost synergies from a bolt-on acquisition not yet completed. Institutional lenders apply haircuts of 25–50% or exclude these entirely from covenant EBITDA.
- Category 4, Red Flag / Rejected: Recurring costs relabeled as one-time; forward-looking revenue projections presented as add-backs; synergies that belong to the buyer, not the seller. Any add-back that describes speculative future cash rather than historical, documented, non-recurring cash is rejected outright.
Example: Analyzing a $10M EBITDA Manufacturing Company
A sponsor presents a manufacturer with the following EBITDA bridge:
| Line Item | Amount | Lender Category | Lender Credit |
|---|---|---|---|
| Reported EBITDA | $7.2M | – | $7.2M |
| Owner salary above market replacement | $0.6M | Category 2 | $0.4M (haircut for replacement cost uncertainty) |
| One-time plant relocation costs | $0.8M | Category 1 | $0.8M |
| COVID-era customer contract loss (FY2020) | $0.4M | Category 4 | $0 (stale, not verifiable) |
| Run-rate savings from ERP implementation | $0.7M | Category 3 | $0.35M (50% haircut, not yet in run rate) |
| Stock-based compensation | $0.3M | Category 2 | $0.15M (lender caps SBC add-back at 50%) |
| Sponsor Adjusted EBITDA | $10.0M | – | – |
| Lender Underwritten EBITDA | – | – | $8.9M |
The delta ($1.1M between sponsor and lender EBITDA) changes the leverage profile from 5.0x to 5.6x. At a 6.0x EBITDA multiple, that same gap translates to over $6.5M of enterprise value mispricing. The lender’s covenant leverage test, set at 5.5x, would already be breached at closing on a lender-underwritten basis.
The Analysis: Walking Through Key Metrics and Calculations
Metric 1: Leverage Ratio (Total Debt / Underwritten EBITDA)
This is the primary structural risk indicator. In the 2025–2026 direct lending market, senior debt-to-EBITDA covenants typically sit between 4.0x and 6.0x, with total leverage (including mezzanine and subordinated layers) reaching 5.5x to 7.5x depending on the credit quality and sector. The EBITDA denominator used for this test is written into the credit agreement with precision, typically a rolling four-quarter LTM calculation with a defined list of permitted add-back categories. Any add-back that doesn’t appear in that enumerated list doesn’t count, regardless of what the sponsor’s model assumed.
Metric 2: Debt Service Coverage Ratio (DSCR)
DSCR measures whether the borrower’s cash flow can comfortably cover all debt service obligations, both principal amortization and interest. The formula is: DSCR = (Underwritten EBITDA, Capex, Taxes, Working Capital Requirements) ÷ Total Annual Debt Service. For leveraged corporate credits in the middle market, lenders typically require a minimum DSCR of 1.25x at origination, with stress-tested scenarios run at 1.0x. A ratio below 1.0x means cash flows cannot cover debt service without external liquidity support, a position that should be treated as a covenant trigger, not a closing condition. Studies have shown that a 10% EBITDA compression combined with a 50-basis-point rate increase can push more than 25% of leveraged middle-market borrowers below 1.0x coverage, making the DSCR stress case a non-negotiable underwriting step.
Metric 3: The Add-Back Concentration Ratio
This is a frequently overlooked but analytically powerful risk signal. It measures the percentage of Adjusted EBITDA that consists of non-cash or run-rate add-backs rather than actual historical cash earnings. As a practical rule: if more than 25% of EBITDA comprises run-rate savings and non-cash add-backs, independent validation is required and lenders should haircut covenant-setting EBITDA accordingly. Credit committees now treat high add-back concentration as a standalone credit risk, particularly in a rising-rate environment where those theoretical savings may never materialize while actual debt service costs compound in real time.
Stress Scenario: Revenue Compression Test
Apply a 15–20% revenue haircut to underwritten EBITDA and recalculate leverage and DSCR. For the manufacturing example above: a 15% revenue decline on $8.9M underwritten EBITDA produces roughly $7.6M in stress EBITDA, pushing leverage from 5.6x to 6.6x, beyond almost any senior covenant threshold. This is the scenario a lender must model before closing, not discover 18 months into the hold period.
Industry Standards: What Institutional Lenders Are Seeing Now
The private credit market has expanded rapidly, with corporate lending AUM expected to exceed $2 trillion in 2026 and grow toward $4 trillion by the end of the decade. That growth, however, has come with structural stress that demands more rigorous EBITDA underwriting discipline, not less.
📊 Credit Performance Data Box
- Private Credit Default Rate (2025): Moody’s estimates the 2025 private credit default rate ranged between 1.6% (excluding distressed exchanges) and 4.7% (including them), reflecting a wide band of uncertainty driven by the prevalence of soft credit events.
- Distressed Exchanges as Share of Defaults: Approximately 65% of all corporate defaults in 2025 were distressed restructurings, not hard payment defaults, the highest annual share on record. This is critical context: the headline default rate understates actual credit stress.
- First-Lien Recovery Rates: Moody’s estimates expected ultimate recoveries on U.S. first-lien loans at roughly 68%, down from the historical high-70s average, driven by loan-heavy capital structures with insufficient junior debt to absorb losses.
- Add-back Inflation: According to S&P Global research (2026), add-backs in the average sale process now account for approximately 29% of adjusted EBITDA, and only 8% of companies have post-closing EBITDA that exceeds management projections presented before signing.
- Middle-Market Leverage: S&P Global Ratings reported that average leverage for U.S. middle-market companies reached 7.0x in 2024, with approximately 20% of firms already below 1.0x EBITDA interest coverage at origination.
Sources: Moody’s (2026), S&P Global Ratings (2024–2026), Pitchbook LCD Distressed Weekly (August 2025)
Common Red Flags Institutional Lenders Flag at Credit Committee
- Wide Reported-to-Adjusted Gap: A 20–30% or greater gap between reported and adjusted EBITDA is a material diligence trigger. Buyers and lenders should challenge every line item in this scenario, particularly any single add-back exceeding 5% of total EBITDA.
- Relabeling Recurring Costs as One-Time: Restructuring charges that appear in three consecutive fiscal years, or “integration costs” that persist well beyond the acquisition date, are recurring expenses, not add-backs.
- Stock-Based Compensation Overreach: Many lenders now cap SBC add-backs or require dual EBITDA presentation (with and without SBC) because SBC represents real economic cost that must be replaced with cash compensation or diluted equity if conditions change.
- Forward-Looking Revenue Add-backs: Any adjustment that represents anticipated revenue not yet reflected in trailing financials (price increases not yet invoiced, new customers not yet onboarded) should be assigned zero credit in base-case underwriting.
- Aging Add-backs: An add-back referencing a disruption from three or more years prior (e.g., COVID-era revenue loss) has already been absorbed into the company’s operating history. Applying it again is double-counting.
Underwriting Checklist: EBITDA Normalization Diligence Protocol
Use this step-by-step protocol at the credit screening and full underwriting stages:
- Request Three-Year Audited Financials + LTM: Build a trend EBITDA table showing reported, adjusted, and lender-underwritten figures for each period. Inconsistencies in the bridge across years are a red flag.
- Map Every Add-back to a Document: Each adjustment requires source documentation: legal invoices for one-time settlements, board-approved salary benchmarks for owner comp normalization, HR records for severance. No document, no credit.
- Apply the Four-Category Screen: Classify every add-back as Clearly Defensible, Conditionally Accepted, Discounted/Haircut, or Red Flag/Rejected. Build a lender-underwritten EBITDA total from Category 1 and 2 items only, with haircuts applied.
- Calculate Add-back Concentration Ratio: (Total Add-backs ÷ Adjusted EBITDA). If >25%, escalate to senior credit review and require independent QoE validation before proceeding.
- Reconstruct Leverage and DSCR on Lender EBITDA: Recalculate all credit ratios using your underwritten number, not the sponsor’s. If leverage exceeds policy thresholds on lender EBITDA, the deal requires restructuring or declines.
- Run a 15–20% Revenue Stress Case: Apply the revenue haircut and recalculate leverage and DSCR. Confirm that the stressed DSCR remains above 1.0x and that stressed leverage does not materially breach covenant thresholds.
- Confirm Credit Agreement EBITDA Definition Matches Underwriting: The credit agreement’s permitted add-back list must align with the adjustments your underwriting team accepted. Discrepancies create a covenant arbitrage risk, borrowers can engineer compliance while actual performance deteriorates.
- Commission or Review an Independent QoE: On any transaction above $5M EBITDA, an independent Quality of Earnings report from a credentialed accounting firm is best practice. The QoE will independently verify adjustments and flag revenue quality, customer concentration, and working capital normalization issues that management presentations typically obscure.
Key Takeaways for Credit Professionals
- 🔸 Adjusted EBITDA is a starting point, never a conclusion. Lenders must independently reconstruct a normalized earnings figure using the four-category framework, applying rigorous documentation standards to every proposed add-back.
- 🔸 Add-back concentration above 25% is a structural credit risk. High non-cash and run-rate add-back concentration creates phantom earnings that inflate leverage multiples and compress actual debt service cushions, particularly dangerous in a stress scenario.
- 🔸 The leverage multiple you underwrite is only as reliable as the EBITDA denominator. A $1.1M EBITDA discrepancy in a $10M deal can shift leverage from 5.0x to 5.6x, breaching covenant thresholds before the first quarterly test.
- 🔸 Default risk in private credit is materially understated by headline rates. With approximately 65% of 2025 corporate defaults being distressed exchanges rather than hard defaults, lenders must monitor portfolio credits at the issuer level, not rely on top-down optimism from falling headline numbers.
- 🔸 First-lien recovery assumptions require updating. With Moody’s estimating first-lien recoveries near 68% versus a historical high-70s average, lenders in loan-heavy capital structures should model 60–70% recovery in base case and 45–60% in AAA stress scenarios, not legacy assumptions.


