
The Underwriting Question That Determines Everything
Every credit decision (leverage tolerance, pricing, covenant design, and maximum loan size) traces back to a single number: EBITDA. Yet in middle market and leveraged lending, few figures are more aggressively engineered by the sell-side. A borrower presents $12M in Adjusted EBITDA. The lender underwrites $9.2M. That $2.8M gap represents the difference between a 5.2x leverage deal and a 6.8x leverage deal, a structurally distinct risk outcome.
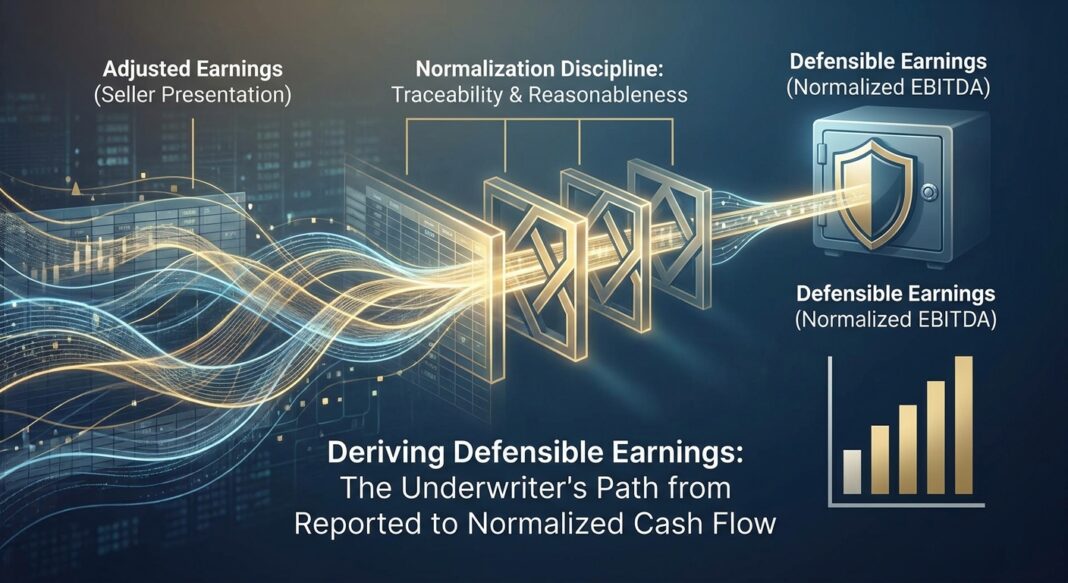
The normalization discipline (the process of building a rigorous, evidence-tested bridge from reported earnings to sustainable cash flow) is the most consequential analytical task in credit underwriting. Done poorly, it creates the illusion of debt capacity that doesn’t exist. Done rigorously, it surfaces the real leverage multiple, constrains aggressive add-backs, and anchors covenant thresholds to economic reality.
This is not an academic exercise. Inflated EBITDA bases are embedded in the default data. According to Moody’s Ratings, distressed exchanges, many of which involve borrowers whose debt was underwritten against optimistic EBITDA, accounted for 64% of all defaults in the first half of 2025, roughly matching the pace of 2024, which itself was the highest annual share on record. The normalization problem is a systemic one.
The Analytical Framework: Three Versions of EBITDA
Institutional underwriters distinguish three distinct earnings concepts that are routinely conflated by borrowers and advisors:
- Reported EBITDA: The raw GAAP figure from the income statement. Starting point only.
- Adjusted EBITDA: Reported EBITDA with management-proposed add-backs applied: non-recurring items, owner-specific expenses, and non-cash charges. This is the seller’s narrative.
- Normalized EBITDA: The earnings base that survives independent diligence. It reflects adjustments that are documented, repeatable, and consistent with how the business will actually operate post-close under arm’s-length ownership.
As Auxo Capital Advisors describes it in their QoE framework, normalized EBITDA is the sustainable earnings base buyers and lenders try to underwrite, not simply the seller’s highest adjusted EBITDA presentation. Adjusted EBITDA starts with management’s add-backs; normalized EBITDA reflects only the adjustments that survive diligence and support a repeatable run-rate.
The credit underwriter’s job is not to accept the adjusted figure. It is to reconstruct normalized EBITDA independently and then underwrite leverage and coverage ratios against that number, not the borrower’s presentation.
The Four Categories of Add-Back Treatment
Experienced lenders classify every proposed add-back into one of four buckets:
| Category | Description | Lender Treatment |
|---|---|---|
| Fully Accepted | One-time legal settlements, transaction costs, non-cash impairments with documentary support | Credited at full value with backup documentation |
| Partially Accepted | Excess owner compensation above market replacement, related-party rent above/below market | Credited at the market differential only; lender normalizes to replacement cost |
| Haircut Applied | “One-time” costs that recur in multiple periods, restructuring charges appearing annually | Partially credited or disallowed; recurring items treated as run-rate costs |
| Rejected | Pro forma synergies, future cost savings not yet realized, speculative revenue run-rates | Not credited; belong in buyer’s upside model, not in purchase-price EBITDA base |
The most critical rule: pro forma and synergy adjustments are routinely rejected by institutional buyers and QoE firms. Normalized EBITDA describes historical, repeatable cash flow, not what the company would have earned under hypothetical assumptions. Lenders and institutional buyers underwrite the historical and discount the hypothetical.
Walking the Calculation: A $10M EBITDA Manufacturing Company
Consider a PE-backed industrial manufacturer presenting the following EBITDA bridge in its CIM ahead of a $55M unitranche financing:
| Line Item | Amount | Sponsor Claim |
|---|---|---|
| Reported EBITDA (LTM) | $7,400,000 | – |
| + Owner excess compensation add-back | $800,000 | Owner paid $1.4M vs. $600K market CEO salary |
| + One-time ERP implementation costs | $650,000 | Non-recurring system upgrade |
| + Legal settlement (product liability) | $420,000 | One-time, fully settled, documented |
| + Pro forma savings from planned headcount reduction | $730,000 | 12 positions eliminated post-close |
| Sponsor Adjusted EBITDA | $10,000,000 | 5.5x leverage on $55M loan |
The underwriter now applies independent scrutiny to each line:
- Owner compensation: Market replacement CEO salary validated at $680K (not $600K) via compensation benchmarks. Accepted add-back: $720K (not $800K). Reduction: -$80K.
- ERP implementation: Review of prior three years reveals a prior platform migration in 2021. Pattern suggests recurring systems investment. Lender applies a 50% haircut. Accepted: $325K. Reduction: -$325K.
- Legal settlement: Fully documented, no pending related claims. Accepted in full: $420K. No reduction.
- Pro forma headcount savings: Rejected entirely. No executed termination agreements, no documented plan, positions still fully staffed. Reduction: -$730K.
Lender Normalized EBITDA: $8,335,000: a 16.7% reduction from the sponsor’s presentation.
At $55M in debt, the actual leverage multiple is 6.6x, not 5.5x. The Fixed Charge Coverage Ratio (FCCR), assuming $4.8M in annual debt service (interest + amortization), drops to approximately 1.16x: uncomfortably close to the covenant floor most lenders set at 1.10x to 1.20x. A deal that appeared comfortably structured is revealed to carry meaningful tightness on coverage.
Key Calculation: FCCR = Normalized EBITDA – Capex – Taxes – Working Capital Changes ÷ Debt Service (Interest + Scheduled Amortization). At $8.335M EBITDA less $900K maintenance capex less $480K cash taxes, available cash flow is approximately $6.955M against $4.8M in debt service: FCCR = 1.45x. Viable, but stress-testing a 15% EBITDA decline pushes coverage to 1.18x, below most covenant minimums.
What Institutional Lenders Actually Require: Standards and Red Flags
The Lender’s Normalization Standard
Institutional lenders treat seller-provided add-back schedules as a starting point, not a conclusion. Lenders independently evaluate normalized EBITDA during underwriting: every adjustment must be traced to source documents: tax returns, bank statements, payroll records, or third-party invoices. The standard, as articulated by multiple practitioners in the QoE community, is traceability and reasonableness: Can the adjustment be traced to records? Is the rationale clear? Would the cost truly disappear under new ownership?
Furthermore, lenders must understand that normalized EBITDA can be lower than adjusted EBITDA when the business requires additional costs under new ownership: such as hiring a replacement management team, paying market-rate rent on a previously below-market related-party lease, or funding capex that had been deferred.
Critical Red Flags in EBITDA Presentations
- The perpetually non-recurring item: Any cost category labeled “one-time” appearing in two or more of the trailing three years should be treated as a run-rate expense. Restructuring charges, ERP migrations, and “extraordinary” professional fees are the most common offenders.
- The hockey-stick run-rate: An LTM period that ends during an unusually strong quarter, annualized to create a forward run-rate that excludes seasonality or cyclicality. Lenders should require a trailing 24-month or 36-month view alongside the LTM.
- Undisclosed customer concentration: A QoE review must validate that LTM revenue is not disproportionately driven by one or two customers whose contract renewal is approaching or uncertain. Revenue quality is as important as revenue quantity.
- Aggressive stock-based compensation add-backs: Many PE buyers exclude stock-based compensation when calculating debt capacity specifically because lenders underwriting leverage ratios should not extend credit against earnings inflated by adding back genuine compensation costs.
- The wide bridge: A large gap between reported and adjusted EBITDA is itself a signal. As PKF O’Connor Davies observed in their 2025 transaction analysis, the bridge between reported and adjusted EBITDA has become a red flag in the eyes of diligence teams that needs to be proactively addressed.
Credit Performance Data Points
- Distressed exchanges as % of defaults: 64% of all defaults in H1 2025, per Moody’s Ratings, the same pace as full-year 2024, which itself was the highest annual share on record. Many involve borrowers originally underwritten against optimistic EBITDA bases.
- Middle market payment defaults (2024): KBRA observed only 21 payment defaults (1.1% by count) across 1,903 unique middle market sponsored borrowers in 2024, though approximately 5% of the portfolio was flagged as most at risk entering 2025, citing weak performance and limited financial flexibility.
- Leveraged loan trailing default rate (Aug 2025): Conventional payment defaults stood at 1.36% per PitchBook LCD, while the combined rate including distressed liability management exercises reached 4.37% by issuer count, below the recent high of 4.70% in December 2024.
- LME share of default activity: Liability management exercises comprised 73% of the default landscape at the 2025 peak, up from just 9% in January 2020, per CreditSights data. Covenant-lite loan documentation has been the structural enabler of this trend.
- High-yield projected default rate: Moody’s projected a high-yield issuer default rate of 3.2% for full-year 2025, with a trajectory toward above 4% by Q1 2026, still below the 4.5% historical average since 1996, but pointing to a rising environment for lenders.
The LME data carries a direct underwriting lesson: covenant-lite loan structures, often justified by the lender’s confidence in a strong EBITDA base, are precisely the conditions that allow borrowers to execute uptier transactions, drop-down maneuvers, and distressed exchanges that dilute non-participating creditors. Rigorous EBITDA normalization at origination is therefore not only a valuation discipline; it is a covenant structuring discipline that determines whether a lender retains meaningful protection when performance deteriorates.
The EBITDA Normalization Underwriting Checklist
Documentation Requirements
- ☐ Three years of audited or reviewed financial statements (CPA-prepared minimum)
- ☐ Trailing 12-month management accounts with monthly detail
- ☐ Federal tax returns for three years (cross-reference to financial statements)
- ☐ Bank statements for prior 12 months (cash flow validation)
- ☐ Detailed general ledger or trial balance for each add-back line item
- ☐ Third-party payroll records or W-2s for owner compensation add-backs
- ☐ Invoices, settlement agreements, or contracts for all claimed one-time items
Analytical Diligence Steps
- ☐ Build your own EBITDA bridge independently before reviewing the sponsor’s, compare the two
- ☐ Verify revenue recognition: are revenues recognized at the correct period? Any deferred revenue acceleration?
- ☐ Analyze gross margin trends across 12 quarters, unexplained margin expansion in the LTM period is a red flag
- ☐ Compute a normalized maintenance capex figure from historical capex schedules and asset age; do not use management’s forward-looking capex estimate as the baseline
- ☐ Stress-test normalized EBITDA at −10%, −20%, and −30% scenarios and calculate the resulting FCCR and Debt/EBITDA at each level
- ☐ Apply a customer concentration adjustment: model the impact of losing the single largest customer
- ☐ Confirm that working capital assumptions are consistent with the business’s actual cash conversion cycle
Questions to Ask the Borrower and Sponsor
- ☐ For every add-back exceeding $100K: What specific invoice or record supports this? In which month did it occur?
- ☐ Has this type of expense occurred in prior years? If so, why is it classified as non-recurring?
- ☐ Are there any related-party transactions (leases, management fees, shared services) not reflected in the adjustments?
- ☐ What is the status of all pending legal proceedings? Have any new claims arisen since the most recent financial statement date?
- ☐ Which employees or functions are being added back as owner-specific? What is the documented market replacement cost?
Key Takeaways for Credit Underwriters
- The multiple is the output, not the input. Institutional lenders build their own normalized EBITDA independently, then derive leverage and coverage ratios from that number, not from the sponsor’s adjusted figure.
- Every dollar of inflated EBITDA is multiplied. At a 6x debt multiple, a $500K unsupported add-back creates $3M of phantom debt capacity. That phantom capacity has a direct relationship to credit loss in downside scenarios.
- Pro forma and run-rate add-backs are not normalized EBITDA. Future cost savings, synergies, and annualized partial-period revenues belong in the buyer’s investment model, not in the earnings base against which debt is sized.
- FCCR stress-testing is non-negotiable. A normalized EBITDA that produces a 1.45x FCCR at close may breach a 1.15x covenant floor with a single quarter of underperformance. Lenders must model coverage at multiple stress scenarios before approving covenant levels.
- Covenant protection begins at underwriting. The surge in liability management exercises, representing 73% of default events at the 2025 peak, is structurally enabled by covenant-lite documentation. Lenders who underwrite tight, defensible EBITDA bases earn the standing to insist on maintenance covenants that provide early warning and intervention rights.


