
Underwriting & Risk Management
EBITDA Adjustments and Normalization: The Credit Underwriter’s Discipline for Building a Defensible Earnings Base
August 22, 2026 | Bond Capital Editorial Desk
The Underwriting Challenge: When the Number on the Page Isn’t the Number You Can Lend Against
You are reviewing a confidential information memorandum for a $10M EBITDA specialty manufacturing company. The sponsor’s adjusted EBITDA bridge runs four pages and adds back $3.2M in charges: including $800K in "one-time" ERP costs that have appeared for three consecutive years, $500K in management fees to the selling family, $400K in personal aircraft expenses, and $1.5M in post-close "synergy savings" from a headcount reduction that has not yet occurred. The headline leverage multiple is 4.7x. After your own normalization, it is 6.9x.
This gap is not an edge case. It is the defining underwriting risk in middle market private credit today. As deal processes have grown more competitive and sponsor-side financial engineering has become more sophisticated, the distance between reported EBITDA and lender-underwritten EBITDA has widened materially. Getting that number right is not a formality; it is the foundation upon which every covenant, every coverage ratio, and every recovery assumption in your credit agreement is built.
This article provides a rigorous, step-by-step framework for EBITDA normalization from the lender’s perspective: how to build a defensible earnings base, which add-backs to accept or reject, how the output flows into key credit metrics, and what the current default environment reveals about the consequences of getting it wrong.
The Framework: Adjusted vs. Normalized EBITDA, Two Different Underwriting Questions
Credit practitioners must distinguish between two related but distinct concepts before a single number is accepted:
- Adjusted EBITDA is the bridge from reported financials to a cleaned-up earnings number after removing one-time and non-operating items.
- Normalized EBITDA goes further, reflecting the earnings a lender can sustainably underwrite after considering steady-state staffing, market-rate compensation, and necessary reinvestment costs under new ownership.
Normalized EBITDA can be, and frequently is, lower than adjusted EBITDA. A sponsor may adjust out the outgoing CEO’s $1.2M salary without inserting a $400K market-rate replacement cost. A lender must insert it. The difference is not a rounding error; at a 7.0x multiple, a $200K over-adjustment translates to $1.4M of phantom enterprise value and an equivalent overstatement of debt capacity.
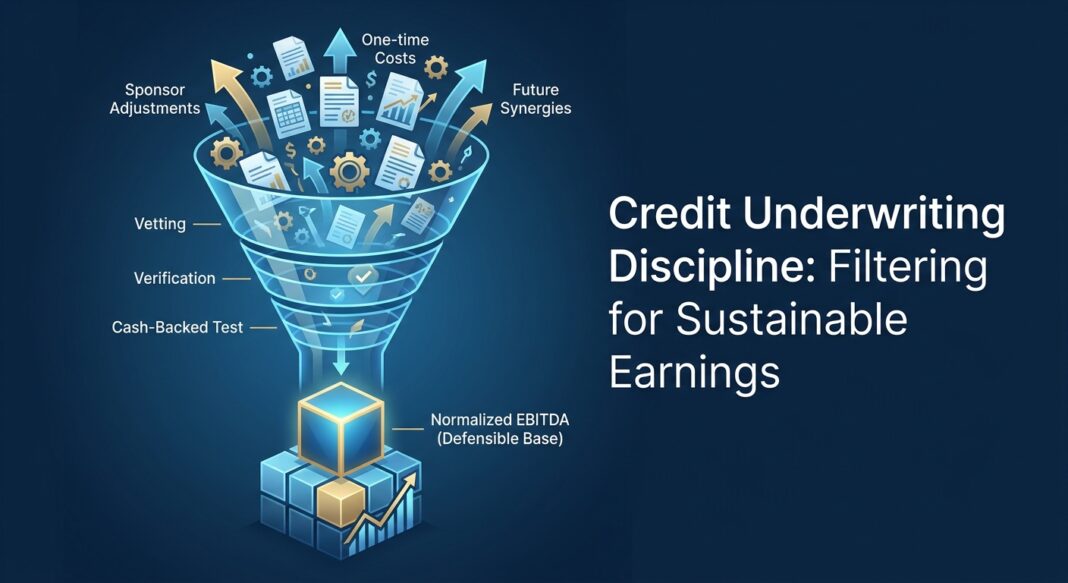
The lender’s normalization process should answer four questions for every line item in the adjustment schedule:
- Is it non-recurring? Can it be traced to documented records, and is there a credible reason it will not repeat?
- Is it cash-backed? Does the add-back represent a real cash saving, or merely an accounting reclassification?
- Is it already in the run rate? Implemented price increases and completed cost actions may receive credit if invoices and retention data confirm they are fully reflected in trailing results, anticipated changes may not.
- Does it belong to the seller or the buyer? Post-close synergies, procurement savings, and shared-services benefits generated by the acquirer are not seller EBITDA and should not be underwritten into the lender’s base case.
"Sellers who treat adjusted EBITDA as a marketing exercise rather than an underwriting exercise consistently lose credibility and leverage during diligence."
Windsor Drake, Adjusted EBITDA: The Complete Guide
The Analysis: Walking Through a $10M EBITDA Normalization
Consider the following illustrative normalization bridge for a $10M reported EBITDA manufacturing company at the time of acquisition financing underwriting:
| Adjustment Item | Sponsor Claim | Lender Decision | Lender Credit |
|---|---|---|---|
| Reported EBITDA (LTM) | $10,000,000 | Accepted | $10,000,000 |
| Management fee to selling family | +$500,000 | Accepted (confirmed termination at close) | +$500,000 |
| Personal aircraft / travel | +$400,000 | Accepted with documentation | +$400,000 |
| One-time ERP implementation | +$800,000 | Rejected (recurring 3 consecutive years) | $0 |
| Post-close headcount reduction savings | +$1,500,000 | Rejected (not yet implemented) | $0 |
| Market-rate CEO replacement cost | $0 inserted | Lender inserts replacement cost | -$350,000 |
| Lender-Underwritten Normalized EBITDA | $13,200,000 | – | $10,550,000 |
The delta is $2.65M. At 5.0x total debt ($52.5M against sponsor-claimed EBITDA), the lender-underwritten leverage is actually 4.98x: still within appetite. But if the sponsor pushes for 6.0x total debt ($79.2M), the lender-underwritten leverage reaches 7.5x, well outside most middle market credit policies and into territory where a mild EBITDA stress tips coverage ratios into default territory.
This arithmetic has direct policy consequences. S&P Global data shows that average leverage across its U.S. middle market credit estimate population hit 7.0x in 2024, with 20% of companies already below 1.0x EBITDA interest coverage. Under a mild stress scenario (a 10% EBITDA decline and a 50-basis-point rate increase) more than 25% of firms breach the 1.0x coverage threshold. The EBITDA base you underwrite today determines which side of that line your borrower is on in a downturn.
Industry Standards: What the Data Says About Add-Back Discipline and Default Risk
The current private credit environment provides a clear empirical case for normalization rigor. Default and recovery benchmarks from institutional sources paint a nuanced but urgent picture:
📊 Credit Performance Data Box
- Private Credit Default Rate (2025): Moody’s estimates the private credit default rate ranged from approximately 1.6% to 4.7% in 2025, depending on whether distressed exchanges are included in the count.
- Distressed Exchange Composition: Distressed restructurings (including debt exchanges and maturity extensions agreed under duress) accounted for roughly 65% of all 2025 private credit defaults, materially influencing how default risk is measured.
- Q1 2026 Default Rate Trend: Proskauer’s Private Credit Default Index, tracking 697 loans totaling $189.2 billion, recorded a 2.73% default rate in Q1 2026, up from 1.84% just two quarters earlier, a sign that latent stress is converting into realized credit events.
- Middle Market Recovery Rates: S&P Global found that U.S. middle market CLO managers were able to exchange defaulted loans at approximately 80 cents on the dollar on average, comparing favorably to first-lien recoveries in the broadly syndicated loan market which were in the low- to mid-70s range.
- Middle Market Leverage (2024): According to PGIM, middle market first-lien debt averaged 4.5x leverage (Debt/EBITDA) as of September 30, 2024, versus 5.8x in the broadly syndicated loan market, though S&P’s broader middle market credit estimate universe showed average leverage of 7.0x, illustrating the dispersion in underwriting quality.
Common Red Flags That Experienced Lenders Reject
Seasoned private credit underwriters consistently flag the following add-back categories for heightened scrutiny or rejection:
- Recurring charges labeled "one-time": IT upgrades, consulting retainers, and restructuring charges that appear across multiple trailing periods are recurring operating costs, not normalizations.
- Synergy add-backs pre-implementation: Anticipated headcount savings, procurement benefits, or operational efficiencies that have not been executed should not enter the lender’s base case EBITDA.
- Stock-based compensation add-backs in leverage calculations: Stock-based compensation represents a genuine economic cost of employing people; extending leverage credit against an add-back that inflates earnings by removing real compensation cost is an underwriting error that many experienced PE lenders explicitly reject.
- Sudden margin expansion without operational explanation: Unexplained gross margin improvement (without a clear pricing action, mix shift, or cost reduction) is a classic indicator of aggressive revenue recognition or cost reclassification.
- Run-rate add-backs without supporting documentation: Every adjustment must be traceable to records; "traceability and reasonableness", not perfection, is the institutional lender standard.
The EBITDA Normalization Underwriting Checklist
Use this sequential diligence framework when receiving a sponsor-adjusted EBITDA schedule for any middle market credit opportunity:
Step 1: Reconstruct from Source Documents
- ☐ Request three years of audited or reviewed financial statements plus LTM financials
- ☐ Tie reported EBITDA independently to the trial balance, do not begin from the sponsor’s bridge
- ☐ Confirm revenue recognition policy and identify any deferred revenue, bill-and-hold, or pull-forward activity
Step 2: Evaluate Each Add-Back Individually
- ☐ Obtain invoices, board minutes, or legal documentation for every adjustment above $50K
- ☐ Confirm the item has not recurred in the prior two fiscal years, if it has, reject or haircut
- ☐ Assess whether the cost would truly disappear under new ownership and new management
- ☐ Insert market-rate replacement costs for all departing executives or owners
Step 3: Test the EBITDA-to-Cash Conversion
- ☐ Calculate the QoE ratio: Operating Cash Flow ÷ Net Income (ratio above 1.0x signals cash-backed earnings)
- ☐ Analyze working capital trends, expanding receivables or inventory relative to revenue is a red flag
- ☐ Confirm maintenance capex levels; EBITDA minus maintenance capex (levered free cash flow proxy) must support debt service
Step 4: Calculate Key Credit Metrics on Lender-Underwritten EBITDA
- ☐ Total Debt / Lender EBITDA (target: ≤4.5x first lien for middle market; flag anything above 5.0x)
- ☐ DSCR = Normalized EBITDA – Taxes – Maintenance Capex – Working Capital Change ÷ Total Debt Service (target: ≥1.20x)
- ☐ Interest Coverage = Normalized EBITDA ÷ Total Interest Expense (flag if below 2.0x at entry)
Step 5: Stress Test the Base Case
- ☐ Apply a 10–15% EBITDA haircut (cyclical downside) and recalculate all coverage ratios
- ☐ Model a 100 bps rate increase on floating-rate debt and confirm DSCR remains above 1.0x
- ☐ Identify the EBITDA level at which the borrower trips the most restrictive financial maintenance covenant
Step 6: Documentation Requirements
- ☐ Third-party Quality of Earnings report commissioned by or reviewed by the lender’s team
- ☐ Independent assessment of all add-backs above 10% of reported EBITDA
- ☐ Management representations letter confirming no undisclosed liabilities or related-party transactions
- ☐ Customer concentration analysis (flag if top 3 customers represent more than 40% of revenue)
Key Takeaways
- 🔹 Build your own EBITDA bridge independently. Seller-provided add-back schedules are a starting point, not a conclusion. Lenders who accept sponsor-adjusted EBITDA at face value underwrite against a number they do not control.
- 🔹 Normalized EBITDA is not always higher than adjusted EBITDA. When market-rate management replacement costs, steady-state overhead, and required reinvestment are properly inserted, lender-underwritten normalized EBITDA often comes in below the sponsor’s claimed figure, sometimes materially so.
- 🔹 Leverage math is unforgiving. A $2.65M normalization difference at 5.0x leverage translates to $13.25M in debt capacity, the difference between a manageable capital structure and a covenant breach under moderate stress. Current data shows that a 10% EBITDA decline alone pushes more than 25% of middle market borrowers below 1.0x interest coverage.
- 🔹 Recurring charges disguised as one-time are the most common and most dangerous add-back error. ERP upgrades, restructuring charges, and consulting retainers that appear across multiple trailing periods are structural costs. Accepting them as normalizations is the most frequent source of EBITDA overstatement in middle market underwriting.
- 🔹 Covenant integrity depends on the EBITDA base you set at origination. A defensible, conservatively normalized earnings figure creates meaningful headroom in your leverage and coverage covenants, and gives you an early-warning signal when a borrower begins to deteriorate. The recoveries data supports the discipline: lenders with tighter covenants and stronger documentation in the lower middle market have demonstrated average recovery rates near 86–87 cents on the dollar.


