
Underwriting & Risk Management | Bond Capital
August 17, 2026
The Gap That Breaks Deals, and Credits
Every credit memo in private lending pivots on one number: EBITDA. It anchors leverage ratios, sets covenant thresholds, sizes debt capacity, and ultimately determines whether a borrower can service its obligations. Yet the distance between reported EBITDA and the adjusted figure a sponsor presents at underwriting has never been wider, or more contested.
Consider the anatomy of a typical lower-middle-market sponsor deal: a $10M reported EBITDA manufacturing company arrives in your inbox as an $13.5M adjusted EBITDA story, supported by a 14-line add-back schedule. That 35% uplift is not unusual. What matters is whether it is defensible.
In today’s market, it often is not. Credit committees are increasingly flagging deals where an outsized proportion of EBITDA derives from run-rate savings and non-cash items rather than actual cash generation. As one practitioner framework notes, credit committees now treat high add-back dependency as a credit risk, not merely a financial engineering exercise, a shift aligned with broader private credit market trends toward tighter underwriting standards.
The stakes are measurable. According to Fitch Ratings data, the U.S. private credit default rate reached 9.2% in 2025 within its Privately Monitored Ratings universe, up from 8.1% in 2024, with the highest default incidence concentrated among issuers with EBITDA under $25 million. The vintages that drove those losses were overwhelmingly underwritten in 2021–2022, when sponsors pushed aggressive add-backs with thin support and lenders competed on looseness rather than rigor. Getting EBITDA normalization right is not a technical nicety. It is the first line of credit defense.
The Normalization Framework: From Reported to Underwriting EBITDA
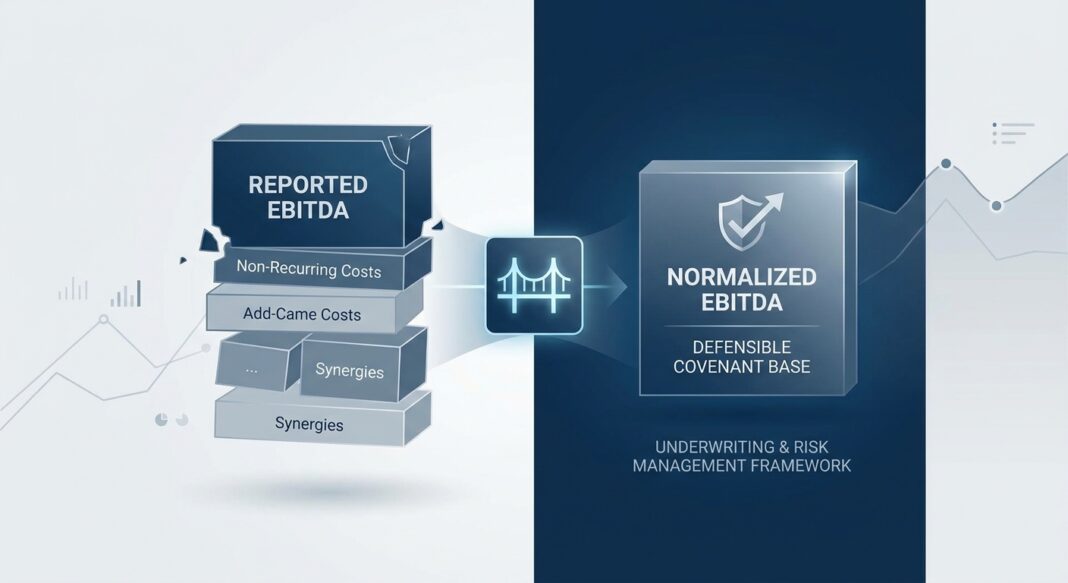
Disciplined lenders distinguish between three distinct EBITDA constructs, each serving a different analytical purpose:
- Reported EBITDA: The figure derived directly from audited or reviewed financial statements: earnings before interest, taxes, depreciation, and amortization. No adjustments. The baseline.
- Adjusted EBITDA: The bridge from reported financials to a cleaned-up earnings number after removing one-time and non-operating items: transaction fees, non-recurring severance, one-off legal costs, and the like.
- Normalized (Underwriting) EBITDA: The earnings level a lender can sustainably underwrite after accounting for steady-state staffing requirements, market-rate management compensation, necessary reinvestment costs, and go-forward operating realities. Normalized EBITDA can be, and frequently is, lower than adjusted EBITDA, particularly when the business requires additional costs under new ownership.
This distinction is not semantic. In middle-market M&A and private credit, the central underwriting question is not “what is the highest defensible EBITDA?”; it is “which version of EBITDA will continue to generate cash after closing?” Sellers naturally focus on the highest possible adjustment case. Lenders must focus on which earnings will persist, which costs must be replaced, and which assumptions belong in upside sensitivity rather than the purchase price or debt sizing.
The Add-Back Taxonomy
Not all add-backs are created equal. A rigorous lender categorizes each adjustment by its evidential quality and realizability:
| Add-Back Category | Example | Lender Treatment | Risk Level |
|---|---|---|---|
| Transaction & deal costs | M&A advisory fees, legal fees specific to the sale process | Generally accepted with documentation | Low |
| Excess owner compensation | Founder salary of $800K vs. $350K market replacement cost | Accepted only after deducting market replacement cost | Low–Medium |
| Non-recurring legal / settlements | One-time litigation settlement | Accepted if matter is fully resolved with no recurring exposure | Medium |
| Implemented price increases (run-rate) | Pricing actions taken pre-close | Credited only if invoices and customer retention data confirm it is in the run rate | Medium |
| Forward cost savings (not yet realized) | Projected headcount reduction post-close | Typically rejected or heavily haircut; depends on post-closing actions | High |
| Non-cash stock-based compensation | Phantom equity, option expense | Accepted for GAAP add-back; scrutinized for sectors with recurring SBC | Medium |
| Related-party normalization | Below-market rent from owner-controlled real estate | Adjusted to arms-length market rent | Low |
The governing standard for any add-back is traceability and reasonableness: Can the adjustment be traced to records? Is the rationale clear? Would the cost truly disappear or change under new ownership? For lower-middle-market borrowers (where accounting may be less formal and cost classification more variable) the standard is not perfection, but it does demand clear documentation and a coherent ownership-transition narrative.
Walking the Bridge: A $10M EBITDA Manufacturing Company
Consider a precision machining business being acquired in a sponsor-led buyout. The deal memo presents the following EBITDA bridge:
| Line Item | Amount | Lender Assessment |
|---|---|---|
| Reported EBITDA (LTM) | $10,000,000 | Baseline, audited |
| + Transaction fees (M&A advisory) | $650,000 | ✓ Accepted, clearly non-recurring |
| + Excess founder compensation ($800K salary vs. $350K replacement) | $450,000 | ✓ Accepted, market comp verified via salary surveys |
| + One-time legal settlement (resolved) | $300,000 | ✓ Accepted, confirmed resolved, no ongoing exposure |
| + Projected cost savings from headcount reduction (not yet implemented) | $800,000 | ✗ Rejected, post-close action, no evidence in run rate |
| + Below-market related-party rent normalization | $180,000 | ✓ Accepted, third-party appraisal provided |
| + Inflated marketing spend (owner’s personal events) | $120,000 | ✓ Accepted, documented as personal |
| Sponsor’s Adjusted EBITDA | $12,500,000 | Presented to lender |
| Lender’s Underwriting EBITDA (add-back haircut applied) | $11,700,000 | $800K unproven savings removed |
The Leverage and Coverage Calculus
With a proposed $52.5M senior secured loan (priced at S+550 bps, call it ~10.5% all-in), the two EBITDA figures produce materially different credit metrics:
| Metric | Using Sponsor EBITDA ($12.5M) | Using Lender EBITDA ($11.7M) | Covenant Threshold |
|---|---|---|---|
| Net Leverage (Debt / EBITDA) | 4.2x | 4.5x | 5.5x (maintenance) |
| DSCR (EBITDA – CapEx / Debt Service) | 1.72x | 1.60x | 1.20x minimum |
| Interest Coverage (EBITDA / Interest Expense) | 2.29x | 2.14x | 1.75x minimum |
At a sponsor-proposed 6.0x EBITDA valuation multiple, that $800,000 in rejected add-backs represents $4.8M in enterprise value, and a meaningful narrowing of covenant headroom. The gap between “acceptable at closing” and “in breach within 18 months” can hinge entirely on add-back quality.
Stress Testing the Normalization
Run three scenarios against lender EBITDA ($11.7M) before final credit approval:
- Base Case: Flat revenue, margins hold at current levels. Leverage at 4.5x, adequate headroom to the 5.5x covenant.
- Downside (–15% EBITDA): One major customer lost, volumes decline. EBITDA drops to ~$9.9M. Leverage moves to 5.3x, uncomfortably close to covenant. DSCR falls below 1.40x.
- Severe Stress (–25% EBITDA): Macro downturn, pricing pressure, key employee departure. EBITDA at ~$8.8M. Leverage breaches 5.5x covenant. Lender engagement required. This scenario tests whether the $800K in unrealized savings was ever credible protection.
The stress test reveals that the lender’s conservatism on add-backs directly protects covenant headroom. Every dollar of unjustified adjusted EBITDA is a dollar of false headroom.
What Institutional Lenders Require, and What the Data Confirms
The 25% Rule and Covenant Consequences
Experienced private credit practitioners operate by a clear threshold: if more than 25% of underwriting EBITDA is derived from run-rate savings and non-cash add-backs, the deal requires either independent validation or a haircut to underwriting EBITDA for covenant-setting purposes. If validation is unavailable, the underwriting EBITDA used for covenant compliance must be reduced, not the sponsor’s ask. This is not arbitrary conservatism; it reflects where defaults are concentrating.
The mechanics of covenant looseness are well-documented. Most private credit deals today carry maintenance leverage covenant headroom of 30% or more above the base case model, with 35%+ headroom now considered “cov-loose” and 40%+ common in aggressive large-cap documentation. The practical effect: by the time a covenant is triggered, the business may already be severely impaired.
The Recovery Rate Equation
Covenant quality and EBITDA discipline are not just pre-close underwriting concerns; they are the primary determinants of recovery outcomes in default. Financial maintenance covenants, tested quarterly in most direct lending facilities, enable lenders to engage at leverage levels that still leave meaningful enterprise value on the table. As one structural analysis framed it: a covenant default at 5.5x leverage in a business worth 7.0x creates a fundamentally different recovery scenario than a payment default at 8.0x leverage in a covenant-lite facility where the first signal of distress is a missed interest payment.
📊 Credit Performance Data Box
- Private credit default rate (2025): Fitch Ratings reported the U.S. private credit default rate at a record 9.2% in its Privately Monitored Ratings portfolio in 2025, up from 8.1% in 2024, with smaller issuers (EBITDA ≤ $25M) defaulting at 15.8% versus 4.0% for issuers with EBITDA over $100M. (Source: Fitch Ratings / Angel Investors Network, August 2026)
- Moody’s private credit default range (2025): Moody’s analysis estimated the private credit default rate in 2025 at approximately 1.6%–4.7% (excluding distressed exchanges), with distressed restructurings accounting for roughly 65% of all credit events. (Source: Moody’s Ratings, April 2026)
- Proskauer Default Index (Q1 2026): Proskauer’s Private Credit Default Index, tracking 697 loans totaling $189.2 billion, recorded a 2.73% default rate in Q1 2026, up from 1.84% just two quarters earlier. (Source: Forbes / Proskauer, May 2026)
- First-lien recovery rates, historical benchmark: Historically, the average recovery on first-lien defaulted loans was approximately 76 cents on the dollar (Moody’s data), with S&P/LCD data showing an average of 75% for first-lien term loans and 52% for second-lien. Recovery rates in direct lending were estimated at roughly 75% and higher, versus approximately 40–60% for broadly syndicated loans. (Source: SLR Capital / PitchBook; Blue Owl / JP Morgan Markets, via PitchBook)
- Covenant erosion and recovery risk: SLR Capital Partners warns that with covenants widened materially in recent vintages, first-lien recoveries going forward may be closer to 50 cents rather than 70+ cents, with software sector recoveries potentially lower still. Covenant protection that allows lenders to engage early is identified as the structural variable distinguishing protected from impaired recovery outcomes. (Source: SLR Capital / PitchBook, August 2026)
- Vintage concentration of losses: The 2021–2022 vintage (when managers competed on loose covenant structures and compressed spreads) is where the majority of current default damage is concentrated. (Source: Angel Investors Network, August 2026)
- Cliffwater CDLI-S annualized loss rate: The Senior Cliffwater Direct Lending Index reported an annualized credit loss rate below 1% since inception (2011–2025), with the broader CDLI (inclusive of junior and mezzanine) producing an estimated annualized loss of 1.47%. (Source: Cliffwater / Morgan Stanley Investment Management, 2026)
Common Red Flags in EBITDA Normalization
- “Recurring” one-timers: The same category of expense (e.g., “integration costs,” “litigation”) appears across multiple trailing periods. By definition, it is not one-time.
- Synergies treated as normalization: Buyer-created benefits (headcount reductions achievable only post-close, revenue synergies from cross-selling) do not belong in the seller’s normalized EBITDA bridge. They belong in upside sensitivity.
- Compensation normalization without market evidence: Replacing a $1.2M founder salary with a $400K assumption requires a market compensation study, not an assertion. Accept the adjustment only with third-party salary benchmarks.
- High add-back concentration with no realization timeline: When run-rate savings and non-cash items represent more than 25% of EBITDA, and no post-close realization schedule is committed to in the credit agreement, the lender is financing hope, not operations.
- Trailing period selection bias: Sellers may cherry-pick the LTM period to exclude a bad quarter or include a seasonally strong one. Require 3 years of annual financials plus interim periods, and normalize for seasonality explicitly.
EBITDA Normalization Underwriting Checklist
📁 Documentation Requirements
- ☐ Three years of audited or reviewed financial statements plus LTM/TTM stub period
- ☐ Detailed add-back schedule with line-item sourcing for each adjustment
- ☐ Supporting invoices, contracts, or payroll records for each material add-back (>$50K)
- ☐ Third-party salary benchmark study for owner/executive compensation normalization
- ☐ Signed lease or third-party appraisal for related-party rent normalization
- ☐ Customer contracts and retention data for run-rate revenue adjustments
- ☐ Integration plan with milestones for any post-close cost savings
🔍 Analytical Steps
- Reconstruct EBITDA independently from raw financial statements, do not start from the sponsor’s bridge.
- Categorize each add-back by type (non-recurring, run-rate, non-cash, normalization) and assign an evidential quality score.
- Calculate what percentage of total adjusted EBITDA each add-back category represents. Flag any deal where run-rate + non-cash items exceed 25% of total.
- Stress-test normalized EBITDA at –15% and –25% scenarios. Map results to all financial covenant triggers and debt service coverage thresholds.
- Build a “lender EBITDA” figure that excludes all unevidenced or post-close-dependent items. Use this, not sponsor EBITDA, for covenant-setting.
- Set covenant levels with a deliberate headroom buffer relative to your base case, not the sponsor’s optimistic model.
❓ Questions to Ask the Sponsor
- Which add-backs have already been verified in the trailing financials versus projected going forward?
- Has any version of this EBITDA been reviewed by an independent Quality of Earnings provider?
- What is the replacement cost for the departing founder’s operational role, not just salary, but institutional knowledge?
- If cost savings are projected post-close, what contractual commitments exist and what is the severance liability?
- Are any add-backs recurring in prior years under different labels?
- How would a future lender or strategic acquirer underwrite this EBITDA at refinancing?
📅 Post-Close Monitoring Protocol
- ☐ Monthly management accounts reviewed against the closing model
- ☐ Quarterly compliance certificates with covenant EBITDA reconciliation
- ☐ Run-rate savings tracked to realization: if over 50% of projected savings are not realized within nine months post-close, require updated plans and covenant reset discussions
- ☐ Watch-list trigger if add-back-dependent EBITDA diverges more than 10% from projections in two consecutive quarters
Key Takeaways for Credit Underwriters
- 🔑 Normalized EBITDA ≠ Adjusted EBITDA. Normalized EBITDA reflects the earnings a lender can sustainably underwrite under steady-state ownership conditions, and it can be materially lower than a sponsor’s adjusted figure. Use it for debt sizing and covenant-setting, not the seller’s bridge.
- 🔑 The 25% threshold is a hard stop. When run-rate savings and non-cash add-backs exceed 25% of total underwriting EBITDA, require independent validation or apply a haircut. Credit committees should treat high add-back concentration as a standalone credit risk factor.
- 🔑 Covenant structure is a recovery instrument, not just a monitoring tool. Financial maintenance covenants tested quarterly, set off conservative lender EBITDA, give lenders the earliest possible intervention point. Covenant erosion directly reduces recovery rates when defaults occur.
- 🔑 Vintage discipline matters more than market-level defaults. The 2025 default cycle concentrated in 2021–2022 vintages underwritten with loose structures and inflated add-backs. The underwriting decisions made today determine the loss outcomes of 2027–2028.
- 🔑 Post-close surveillance is the other half of underwriting. EBITDA normalization is a hypothesis at closing. Monthly tracking of realized versus projected savings, quarterly covenant reconciliation, and proactive watch-list management convert that hypothesis into a managed credit, or identify deterioration before it becomes unrecoverable.


