
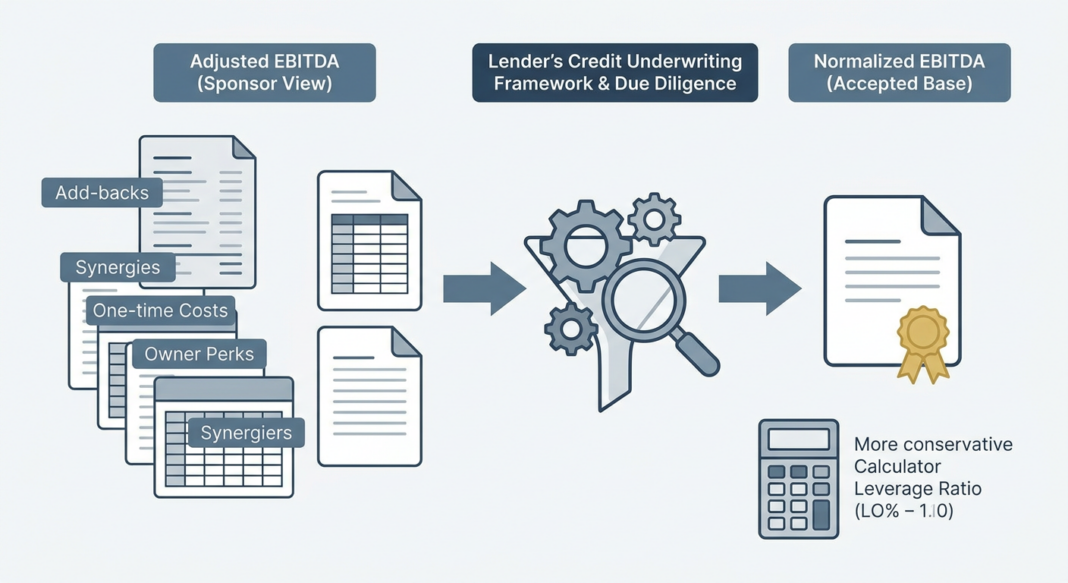
The Underwriting Question Every Credit Committee Must Answer
A sponsor-backed manufacturing company presents a Confidential Information Memorandum showing $12.5 million in Adjusted EBITDA, a 26% lift over the $9.9 million in reported net earnings. The add-back schedule runs to four pages: $1.1 million in one-time legal costs, $800K in restructuring charges, $600K in management fees to be eliminated post-close, and $100K in owner perks. The ask is a $50 million senior secured term loan at 4.0x leverage on the adjusted figure.
The underwriting question is not whether the reported EBITDA is real. It is whether the adjusted EBITDA is real, and whether any version of it can durably support that debt load across a three-to-five year hold period. auxocapitaladvisors.com frames the practical challenge clearly: the issue is not whether a seller can identify possible adjustments, but whether lenders and investment committees will accept those adjustments as recurring economic value.
Getting this wrong is expensive. A single rejected $100K add-back at a 6x multiple costs $600K in enterprise value, and in a credit context, an inflated EBITDA base means leverage is understated, covenants are miscalibrated, and the margin for error in a downside scenario quietly disappears before the ink is dry on the credit agreement.
The Analytical Framework: From Reported to Lender-Accepted EBITDA
Disciplined credit underwriting requires walking through a clearly defined earnings bridge, not accepting management’s adjusted number at face value, but stress-testing each component against three criteria: Is it truly non-recurring? Is it independently verifiable? Does it reflect the business under new ownership?
Step 1: Anchor to Reported EBITDA
Begin with GAAP net income, then add back interest, taxes, depreciation, and amortization. This is the starting point, the number that exists in audited financials. sidley.com notes that EBITDA in private credit agreements begins with consolidated net income and adds back the standard four items before any further adjustments are considered.
Step 2: Evaluate Each Add-Back Category
sidley.com identifies the most actively negotiated add-back categories in current private credit agreements: restructuring and integration costs; transaction expenses; extraordinary, unusual, or nonrecurring losses; pro forma synergies; run-rate adjustments; and company- or industry-specific items. Each must be evaluated on its own merits, not as a bundled schedule.
- One-Time Costs: Legal settlements, restructuring charges, and transaction expenses are presumptively excludable, but lenders must verify they are truly non-recurring. Recurring restructuring costs re-labeled as one-time are among the most common manipulation vectors.
- Owner Compensation Normalization: If the owner earns $400K in a business where a market CEO would cost $250K, only $150K is a valid add-back. Conversely, if the owner is underpaid, the normalization goes down, reducing EBITDA. A credible bridge includes both addbacks and adddowns. (windsordrake.com)
- Pro Forma Synergies: The most contentious category. Run-rate cost savings and synergies may be legitimate, but lenders must require documented execution plans, realistic timelines, and precedent evidence of comparable savings delivered by the management team. (pkfadvisory.com)
- Non-Cash Items: Stock-based compensation, unrealized gains/losses, and mark-to-market adjustments are routinely added back, but lenders should verify the cash-flow impact and ensure non-cash revenue is not inflating the numerator.
Step 3: Distinguish Adjusted EBITDA from Normalized EBITDA
auxocapitaladvisors.com draws the key distinction: adjusted EBITDA usually starts with management’s add-backs, while normalized EBITDA reflects only the adjustments that survive Quality of Earnings diligence and support a repeatable run-rate. In middle-market underwriting, the lender’s job is to converge on normalized EBITDA, not sponsor-proposed adjusted EBITDA.
Step 4: Quality of Earnings Validation
A third-party Quality of Earnings (QoE) report is not optional on a meaningful credit; it is the analytical foundation. auxocapitaladvisors.com explains that a QoE review commonly evaluates revenue recognition, customer concentration, revenue quality, gross margin trends, add-back support, reserves, accounting cutoffs, working-capital behavior, cash conversion, and the relationship between EBITDA and cash flow. The purpose is not just to verify arithmetic; it is to determine whether the earnings base used in valuation is accurate, repeatable, and financeable.
Walking Through the Calculations: A $10M EBITDA Manufacturing Company
Consider the following illustrative earnings bridge for a mid-market industrial manufacturer:
| Item | Amount ($000s) | Lender Verdict |
|---|---|---|
| Reported EBITDA (LTM) | $8,200 | Baseline |
| + One-time legal settlement | $950 | ✅ Accepted (documented, non-recurring) |
| + Owner excess compensation | $350 | ✅ Accepted (market-rate replacement verified) |
| + Projected cost synergies (Year 1) | $800 | ⚠️ Partial credit ($400K with execution plan) |
| + Management fee elimination | $300 | ✅ Accepted (contractually terminating at close) |
| − Below-market related-party rent (add-down) | ($200) | ⬇️ Adddown (market lease cost must be reflected) |
| Lender-Accepted Normalized EBITDA | $10,000 | Used for leverage, covenant, and coverage testing |
The sponsor proposed $12.5M in adjusted EBITDA. The lender’s normalized EBITDA lands at $10.0M: a $2.5M gap that, at 4.0x leverage, translates to $10M less debt capacity and a meaningfully tighter covenant structure. This is why the EBITDA negotiation is the deal.
Key Coverage Metrics to Compute on the Normalized Base
- Total Leverage: Total Debt ÷ Normalized EBITDA. The Federal Reserve’s Interagency Guidance on Leveraged Lending has historically flagged leverage in excess of 6.0x Total Debt/EBITDA as raising concerns for most industries. (federalreserve.gov)
- Interest Coverage Ratio: Normalized EBITDA ÷ Cash Interest Expense. A minimum of 2.0x is a common floor; below 1.5x signals structural fragility. heronfinance.com‘s Q1 2026 benchmark data shows the average borrower interest coverage ratio improved year-over-year due to lower rates and some EBITDA growth, but coverage improvement driven by rate cuts alone is not the same as organic earnings quality.
- Fixed Charge Coverage Ratio (FCCR): (EBITDA − CapEx − Taxes) ÷ (Interest + Scheduled Principal). More conservative than EBITDA/Interest because it captures the full cash drain on the business.
- EBITDA-to-Free Cash Flow Conversion: If EBITDA is $10M but free cash flow is $4M due to high CapEx and working capital consumption, the leverage multiple on a cash basis is far higher than the headline suggests. msllc.com is direct on this point: comparing EBITDA to actual cash flow is essential, if EBITDA rises but the company is not bringing in more operating cash, the improvement may be on paper only.
What Institutional Lenders Look For, and What They Flag
The Regulatory and Institutional Baseline
The Federal Reserve’s Interagency Guidance on Leveraged Lending establishes that a financial institution’s underwriting standards must address whether base-case cash flow projections show the ability to fully amortize senior secured debt or repay a significant portion of total debt over the medium term, and that projections must include realistic downside scenarios reflecting key transaction risks. (federalreserve.gov) This is the institutional floor for any credit seeking bank capital.
msllc.com summarizes how lenders apply this in practice: they will only consider adjustments clearly justified and traced back to financial statements, and they use the most conservative EBITDA definition because it drives debt sizing, covenants, and repayment capacity.
The EBITDA Inflation Problem in Private Credit
The FSB’s May 2026 report on private credit vulnerabilities identified a structural concern: because of the extensive use of add-backs and adjustments, the typical 'true' leverage in private credit could be closer to 7x debt-to-EBITDA, materially above reported figures. (fsb.org) sidley.com notes that because expansive add-backs can materially affect leverage outcomes, prudent lenders impose caps, often expressed as a percentage of EBITDA, on projection-based or nonrecurring adjustments.
Credit Performance Data Box
Key Data Points: Default, Recovery, and Covenant Risk (2025–2026)
- 📊 Leveraged loan default rate (including distressed exchanges) reached approximately 4.37% as of August 2025, per Pitchbook LCD data cited by valuationresearch.com. Conventional payment-only defaults were a far lower 1.36%, highlighting how distressed exchanges now dominate the default count.
- 📊 U.S. private credit default rate climbed to approximately 5.7% by early 2025, per Fitch data cited by resonanzcapital.com, up from near zero in 2022.
- 📊 First-lien senior secured recovery rates have historically run 70–80 cents on the dollar (ultimate basis), but have declined toward 60–70% in recent cycles due to loan-heavy capital structures and liability management exercises. Cov-lite senior secured debt currently trails covenanted loans by roughly 10 percentage points on recovery. (collateralizedloanobligations.com, angelinvestorsnetwork.com)
- 📊 Senior direct lending loss rates have consistently been below 1% since the inception of the Cliffwater Senior Direct Lending Index in 2011, per stepstonegroup.com, but this data predates the first full credit cycle stress in private credit.
- 📊 Covenant erosion: More than 90% of large-cap leveraged loans are now covenant-lite. (angelinvestorsnetwork.com) In the broadly syndicated market, wallstreetprep.com cites S&P Global data showing more than 90% of U.S. leveraged loan issuance in recent years has been covenant-lite.
- 📊 Debt/EBITDA ratios in private credit have been stable with no material upward drift at the portfolio level as of Q1 2026, per heronfinance.com‘s benchmark of 69 private credit funds, suggesting lenders have maintained leverage discipline even as add-back inflation masks true underlying leverage.
Common Red Flags in EBITDA Add-Back Schedules
- Recurring costs relabeled as non-recurring. If restructuring charges appear in three of five historical years, they are not one-time. windsordrake.com is explicit: buyers will reject adjustments that attempt to re-label normal operating costs as exceptional.
- Large synergy assumptions without execution history. pkfadvisory.com notes that for complex pro forma adjustments, buyers and lenders expect not only evidence but a demonstrated history of delivering comparable savings.
- EBITDA rising while operating cash flow is flat or declining. Divergence between accrual earnings and cash generation is one of the most reliable warning signs of earnings quality deterioration.
- PIK interest elections in recent periods. Per the FSB’s 2026 vulnerability report (fsb.org), PIK loans allow borrowers to defer cash interest by adding to principal, providing liquidity but increasing total debt and long-term credit risk. Rising PIK in a portfolio is a stress signal that EBITDA-based metrics may not capture.
- Loose or missing covenant structures. resonanzcapital.com identifies the structural problem: without maintenance covenants, lenders may not learn of deterioration until a payment is missed or liquidity is nearly exhausted, by which point recovery options are materially constrained.
Underwriting Checklist: EBITDA Normalization Due Diligence
The following is a practitioner-level checklist for evaluating EBITDA adjustments during credit underwriting. It should be completed in conjunction with, not as a substitute for, an independent Quality of Earnings report on material transactions.
Documentation Requirements
- ☐ Three to five years of audited or reviewed financial statements (not management-prepared only)
- ☐ LTM financials with monthly or quarterly detail to test trend and seasonality
- ☐ Full add-back schedule with line-item support and GL-level documentation for each item above $100K
- ☐ Third-party QoE report from a recognized accounting firm (not the issuer’s own auditor)
- ☐ Cash flow statement reconciliation: EBITDA to operating cash flow to free cash flow
- ☐ Customer concentration analysis (identify revenue tied to top 5 customers; flag any above 15% of revenue)
Questions to Ask in Diligence
- ☐ Has any add-back category appeared in more than two of the last five years? If yes, it is not one-time.
- ☐ Are projected synergies tied to a specific, time-bound implementation plan with identified owners?
- ☐ What is the cash conversion rate of EBITDA? (Free Cash Flow ÷ EBITDA, flag anything below 50%)
- ☐ Has working capital been trending as a use of cash? Rising DSO or inventory build reduces real cash EBITDA.
- ☐ Are there related-party transactions (rent, management fees, intercompany loans) that must be normalized to market?
- ☐ What maintenance CapEx is required to sustain the EBITDA level? Is this captured in the free cash flow bridge?
- ☐ Has the company elected PIK interest on any obligations? If yes, what does total debt look like on a fully loaded basis?
Covenant Calibration Step
Once normalized EBITDA is established, set maintenance covenant thresholds at 20–25% headroom above the initial leverage ratio, not 35–40% as borrowers frequently push for. covenantlite.substack.com identifies that historically, leverage covenants allowed just 15–25% headroom above initial debt levels, ensuring lenders had ample early warning of performance deterioration. The goal is an actionable early-warning mechanism, not a symbolic guardrail. As sidley.com notes, maintenance covenants tested quarterly provide lenders with visibility into credit deterioration well before a payment default or insolvency event.
Key Takeaways
- 🔵 Normalized EBITDA ≠ Adjusted EBITDA. The sponsor’s adjusted figure is a starting point, not an underwriting input. The lender must reconstruct a defensible, evidence-supported normalized EBITDA that will hold up in a downside scenario, and that number is often materially lower than the CIM presents.
- 🔵 The EBITDA gap has systemic consequences. The FSB’s 2026 analysis found that true leverage in private credit may be closer to 7x when accounting for add-back inflation, meaning entire portfolios are underwritten against an earnings base that may not materialize under stress.
- 🔵 Cash conversion is the acid test. EBITDA multiples are useful but insufficient. Underwriters must close the loop from EBITDA to free cash flow, accounting for CapEx, taxes, working capital, and debt service, because debt is repaid in cash, not EBITDA.
- 🔵 Covenant structure is inseparable from EBITDA quality. A covenanted loan built on a realistic normalized EBITDA base gives the lender meaningful early-warning protection. A covenant-lite loan with an inflated EBITDA definition eliminates the lender’s early engagement rights precisely when they matter most. The 10-percentage-point recovery gap between covenanted and cov-lite senior secured debt is the quantified cost of that structural difference.
- 🔵 Discipline in a competitive market requires institutional will. Morgan Stanley Investment Management’s 2026 private credit outlook identifies that lenders who maintain underwriting rigor, not those who chase volume, are best positioned to capture the illiquidity premium and protect returns through the cycle. The 2023–2025 origination vintage, underwritten in the most competitive environment on record at compressed spreads and weakened documentation standards, will be the true test of that discipline.


