
Underwriting & Risk Management | Private Credit
EBITDA Adjustments and Normalization in Credit Underwriting: A Practitioner’s Framework for Defensible Debt Capacity Analysis
Published: August 23, 2026, Bond Capital Editorial Desk
The Underwriting Challenge: When EBITDA Becomes a Work of Fiction
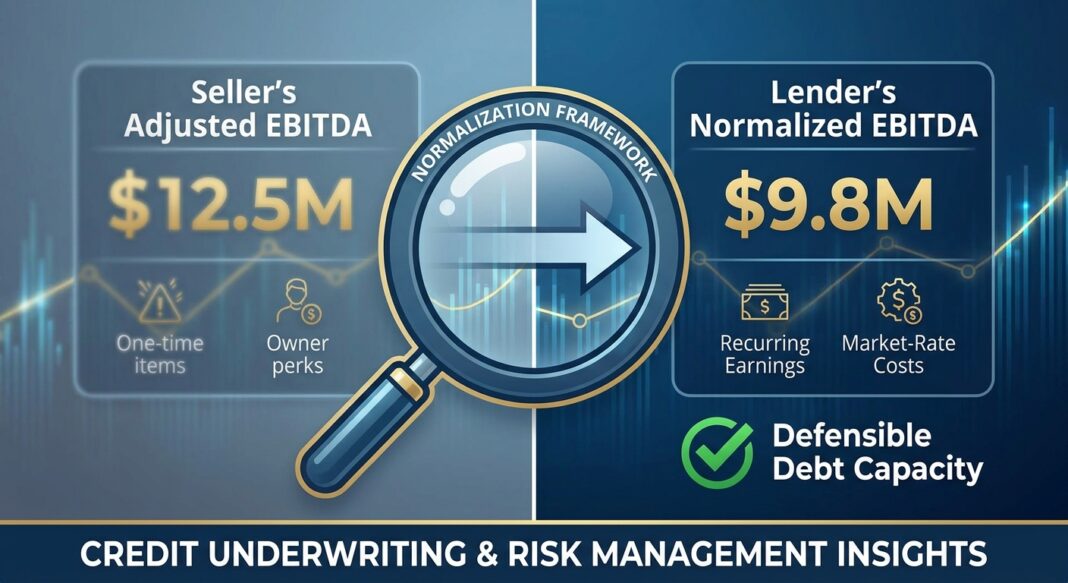
A borrower presents a Confidential Information Memorandum showing $12.5 million in Adjusted EBITDA. By the time a disciplined credit team finishes its normalization work, the lender-underwritten number lands at $9.8 million, a 22% reduction that collapses the deal’s leverage profile from 4.8x to a lender-uncomfortable 6.2x. The deal either reprices, restructures, or dies. This scenario is not hypothetical. It plays out constantly across the middle market.
EBITDA add-backs sit at the precise intersection of valuation risk and credit risk. Every dollar of unsupported adjustment is multiplied by the agreed leverage multiple. As practitioners at PKF O’Connor Davies have observed, the bridge between reported and adjusted EBITDA is no longer a technicality; it has become one of the primary red flags scrutinized by lenders and diligence teams in today’s deal environment.
The stakes are higher than ever. The FSB’s May 2026 report on private credit vulnerabilities identified borrower credit quality concerns and valuation opacity as central systemic risks in a market that has grown to an estimated $1.5–$2.0 trillion in assets. Meanwhile, PwC’s 2026 Private Credit Survey found that 64% of respondents cited defaults and credit losses as their primary concern for the year ahead, a number that traces directly back to underwriting decisions made during periods of competitive pressure. Rigorous EBITDA normalization is the first and most consequential line of defense.
The Analytical Framework: From Reported Earnings to Lender-Underwritten EBITDA
Credit underwriters must maintain a sharp distinction between three related but distinct concepts:
- Reported EBITDA: The GAAP earnings figure as stated in the financial statements, before any adjustments.
- Adjusted EBITDA: Reported EBITDA plus one-time, non-cash, or non-operating items removed to improve comparability, as presented by the seller or sponsor.
- Normalized (Lender-Underwritten) EBITDA: The figure a lender will actually extend credit against: adjusted for sustainable earnings only, market-rate replacement costs, and post-closing operating reality.
The distinction is material. Normalized EBITDA can be lower than Adjusted EBITDA when the business requires additional costs under new ownership that the seller’s schedule omits. Critically, lenders do not accept seller-provided schedules as a conclusion; they are treated as a starting point subject to independent verification.
Example: A $10M EBITDA Manufacturing Business
A sponsor-backed manufacturing company reports the following EBITDA bridge in its CIM:
| Item | Amount | Seller’s Classification |
|---|---|---|
| Reported EBITDA | $8,200,000 | Base |
| Owner compensation above-market | $900,000 | Non-recurring |
| One-time legal settlement | $350,000 | Non-recurring |
| ERP system implementation costs | $310,000 | Non-recurring |
| COVID-era CARES Act grant | $240,000 | Non-recurring income removal |
| Seller’s Adjusted EBITDA | $10,000,000 | – |
On its face, the bridge looks reasonable. The credit team’s job is to challenge every line.
Walking the Bridge: How Lenders Stress-Test Each Adjustment
A disciplined credit team applies the following tests to each add-back before crediting it in underwriting:
1. Owner Compensation ($900K add-back): The team benchmarks a market-rate replacement salary for the owner’s operating role. If the owner manages operations that would cost $500K to replace, only $400K of the $900K excess compensation is a true add-back. The remaining $500K is a real, recurring cost. Lender-accepted adjustment: $400K, not $900K.
2. Legal Settlement ($350K): The team reviews underlying legal exposure. If the matter is fully resolved with no remaining contingent liability, this add-back may stand. If the company faces a pattern of litigation (a potential signal of operational or counterparty issues) the settlement may represent recurring risk. Lender-accepted adjustment: conditional, pending diligence confirmation.
3. ERP Implementation ($310K): Technology and systems investments often recur in some form. The credit team asks: will this company require additional IT capital expenditure in years 1–3? If yes, this may be better treated as a maintenance capex adjustment embedded in the leverage analysis rather than a clean EBITDA add-back. Lender-accepted adjustment: potentially zero.
4. CARES Act Grant ($240K removal): Removing non-recurring government income is correct but requires verification that this income stream has truly ceased. Accepted.
After applying independent judgment, the lender’s normalized EBITDA might settle at approximately $9.1 million, not $10 million. At a proposed $50 million total debt load, leverage shifts from 5.0x (seller’s figure) to 5.5x (lender’s figure), a meaningful difference in risk pricing and covenant headroom. This dynamic mirrors real market data: analysis of middle-market transactions shows that material QoE findings typically reprice deals by 5% to 15%, and in extreme cases reach 30% or more.
The Debt Capacity Multiplier Effect
Every $1 of EBITDA adjustment rejected by a lender reduces the borrower’s available debt capacity by the full leverage multiple. At a 6x leverage ratio, a $300,000 downward EBITDA revision reduces supportable debt by $1.8 million, either forcing equity to fill the gap or triggering a purchase price reduction to restore the target leverage ratio.
Institutional Standards: What Experienced Lenders Actually Underwrite
Understanding where the market sits on key credit metrics is essential for calibrating underwriting standards. The data paints a sobering picture for lenders who are not disciplined about EBITDA quality.
📊 Credit Market Data Box: August 2026
- Interest Coverage Ratio Deterioration: The average interest coverage ratio in private credit loans has declined from approximately 3.2x in 2021 to approximately 1.5x in recent periods, with the proportion of borrowers carrying an ICR below 1.5x rising from 7% in Q4 2020 to 47% today. (Source: Within Intelligence / IMF Financial Stability Report)
- Negative Free Cash Flow Prevalence: IMF data indicates that over 40% of private credit borrowers currently exhibit negative free cash flow, a structural vulnerability that aggressive EBITDA add-backs can obscure until debt service failure. (Source: IMF Global Financial Stability Report, cited in Within Intelligence, 2026)
- High-Yield Default Rate: Moody’s projects that high-yield bond issuers will experience a realized default rate of approximately 3.2% for calendar year 2025, rising to above 4% by Q1 2026. The lower middle market default rate is projected to reach 3% by year-end 2025, driven by a growing pipeline of stressed borrowers. (Sources: Moody’s Credit Strategy US Report, July 2025; KBRA, via Valuation Research Corp., 2026)
- Covenant-Lite Explosion: As of year-end 2024, approximately 91% of outstanding U.S. leveraged loans were covenant-lite, representing roughly $1.29 trillion in face value, with 93% of all new institutional leveraged loan issuance in 2024 structured covenant-lite. (Source: Resonanz Capital analysis, via Angel Investors Network, 2026)
- FCCR Stress: As of Q3 2024, the average Fixed Charge Coverage Ratio across Lincoln International’s tracked private-equity-backed portfolio was approximately 1.1x, with more than a third of companies remaining below the 1.0x threshold. (Source: Lincoln International Private Market Index, Q3 2024)
These numbers crystallize why EBITDA normalization is not a technical formality but a direct determinant of portfolio credit quality. A lender who underwrites to an inflated EBITDA figure enters a leveraged loan with thinner actual coverage than modeled, less covenant protection than assumed, and greater vulnerability to a deterioration cycle that the FSB has explicitly warned could amplify systemic stress.
Institutional lenders apply several structural disciplines to contain add-back risk. Regulated lenders in highly leveraged deals maintain an interest in a conservative EBITDA definition that avoids regulatory red-flag designations. Some credit facilities impose an EBITDA Add-Back Cap: for borrowers with EBITDA below $50 million without a specified rating, one documented credit agreement structures uncapped adjustments at a maximum of 40% of non-adjusted EBITDA. The era when add-back caps of 15%–25% were standard has largely given way to looser structures in the broadly syndicated market, making it even more important for direct lenders to self-impose rigorous norms at origination.
The PwC 2026 Private Credit Survey captures the stakes directly: winning managers in the current environment will be those who demonstrate better underwriting, portfolio management, and restructuring capabilities, as the gap between the best portfolio managers and the rest is expected to increase materially.
The EBITDA Normalization Underwriting Checklist
The following step-by-step checklist reflects institutional practice for credit teams evaluating EBITDA adjustments on any leveraged credit opportunity:
Phase 1: Decompose the Seller’s Bridge
- ☐ Obtain a full, line-item EBITDA bridge with supporting documentation for every adjustment
- ☐ Request the underlying general ledger, invoices, or third-party evidence for each add-back
- ☐ Trace every adjustment back to audited or reviewed financial statements
- ☐ Independently verify LTM (Last Twelve Months) and TTM (Trailing Twelve Months) period definitions
Phase 2: Challenge Each Adjustment Category
- ☐ Owner/executive compensation: Benchmark replacement cost at market rates; accept only the excess above replacement
- ☐ One-time items: Verify the legal or operational matter is fully resolved and non-recurring by nature, not by label
- ☐ Non-cash charges: Distinguish legitimate non-cash items (e.g., amortization of intangibles) from write-downs that signal asset impairment risk
- ☐ Pro forma run-rate adjustments: Credit only price increases and cost savings already embedded in the trailing period with documented evidence (invoices, retention data)
- ☐ Anticipated synergies or post-closing savings: Reject these from the EBITDA base; they belong in sponsor upside modeling, not lender underwriting
- ☐ Related-party transactions: Normalize rent, management fees, and inter-company charges to market rates
Phase 3: Build the Lender-Underwritten EBITDA
- ☐ Construct a parallel, independent normalized EBITDA schedule reflecting only defensible, recurring adjustments
- ☐ Calculate key credit metrics against lender-underwritten EBITDA: Total Debt / EBITDA, Senior Debt / EBITDA, Fixed Charge Coverage Ratio (target: minimum 1.25x at close), and Debt Service Coverage Ratio
- ☐ Run a downside scenario at 15%–20% EBITDA haircut, does the credit remain serviceable? Do covenants hold headroom above 20%?
- ☐ Compare lender-underwritten EBITDA to the seller’s figure: a gap exceeding 10% warrants re-pricing, re-structuring, or additional equity
Phase 4: Documentation and Committee Package
- ☐ Commission or review an independent Quality of Earnings (QoE) report from a qualified third-party accounting firm
- ☐ Document the basis for every accepted and rejected adjustment in the credit memo
- ☐ Ensure the credit agreement’s EBITDA definition is tightly drafted, with add-backs limited to specific, documented categories and, where appropriate, capped as a percentage of unadjusted EBITDA
- ☐ Establish ongoing covenant reporting requirements tied to lender-underwritten metrics, not sponsor-defined metrics
Key Takeaways
- 📌 Seller EBITDA is a starting point, never a conclusion. Lenders must independently reconstruct normalized EBITDA using documented evidence, market benchmarks, and post-closing operating assumptions, not the borrower’s bridge.
- 📌 The multiplier effect makes every dollar count. At a 6x leverage ratio, a $300K adjustment error creates $1.8M of mis-sized debt: compressing coverage, eroding covenant headroom, and pre-loading default risk from day one.
- 📌 Current market data demands heightened vigilance. With over 40% of private credit borrowers reporting negative free cash flow and average ICRs near 1.5x, the margin for EBITDA overstatement in underwriting has effectively disappeared.
- 📌 Covenant-lite structures shift the burden entirely to origination quality. With 93% of new institutional leveraged loan issuance structured covenant-lite, lenders no longer benefit from early-warning breach triggers. Underwriting precision at origination is the primary risk control mechanism.
- 📌 Normalized EBITDA must drive the credit agreement’s legal definition. The EBITDA definition negotiated into the credit facility is as important as the underwritten number itself. A loosely drafted definition allows borrowers to re-inflate EBITDA for covenant compliance testing, defeating the purpose of disciplined origination analysis.


