
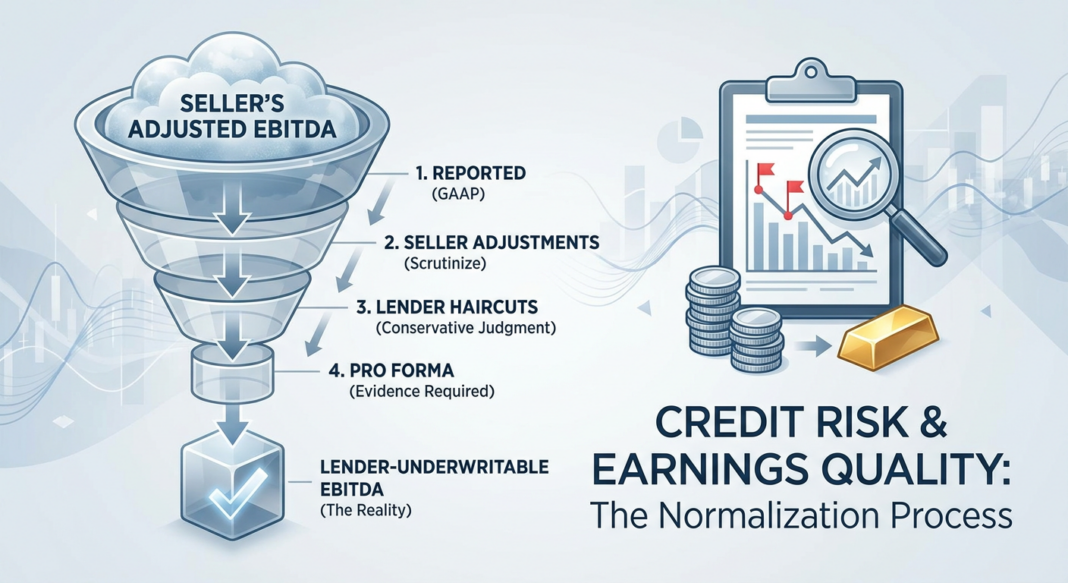
The Underwriting Challenge: When the EBITDA on the Page Is Not the EBITDA You Can Lend Against
Every credit underwriter working in the middle market has faced the same scenario: a confidential information memorandum arrives with a headline Adjusted EBITDA of $10 million. The seller’s add-back schedule is three pages long. It includes restructuring charges from two years ago, a one-time legal settlement, the CEO’s personal aircraft lease, and $1.2 million in projected cost savings from a system integration that has not yet started. The question is not whether these adjustments are listed, it is whether they are real, defensible, and lendable.
EBITDA normalization sits at the heart of credit risk. Because leverage ratios, debt service coverage ratios (DSCRs), and financial covenant thresholds are all calculated off the agreed EBITDA figure, an overstated earnings base inflates debt capacity, compresses apparent leverage, and produces a credit that looks safer than it is. In the current deal environment, this risk is acute. Lenders are tightening underwriting standards and demanding greater transparency from sellers on how Adjusted EBITDA translates to sustainable free cash flow and how recurring and predictable those earnings actually are. At Bond Capital, the EBITDA normalization process is not a formality; it is the first line of credit defense.
The Analytical Framework: A Four-Layer Normalization Process
Experienced credit underwriters treat the seller-provided Adjusted EBITDA as a starting hypothesis, not a conclusion. The goal is to arrive at a Lender-Underwritable EBITDA: a defensible, recurring, evidence-supported earnings figure that reflects how the business actually performs under arm’s-length, ongoing ownership. This process works across four analytical layers:
Layer 1: Reported EBITDA (GAAP Starting Point)
Begin with consolidated net income and add back interest expense, income tax expense, depreciation, and amortization. This is the GAAP-grounded base. It is the only number the auditors have vouched for. Do not skip this step: many sell-side presentations begin with an already-adjusted figure that obscures the bridge from GAAP earnings.
Layer 2: Seller Normalization Adjustments (Scrutinize, Do Not Accept)
Sellers will propose adjustments across four standard categories: (1) owner-specific compensation above or below market replacement cost; (2) personal use of company resources run through the P&L; (3) non-recurring revenue and cost items; and (4) related-party transactions not priced at arm’s length. Each must be traced to the financial statements and supported by third-party documentation. If a seller cannot provide a vendor invoice, a board resolution, or a compensation survey, the add-back does not hold.
Layer 3: Lender Haircuts (Apply Conservative Judgment)
Lenders are cautious by nature and by regulatory obligation. They will only consider adjustments that can be clearly justified and traced back to the company’s financial statements. They use the most conservative EBITDA definition because it drives debt sizing, covenants, and repayment capacity. Common haircuts applied by credit committees include: (a) removing forward-looking synergy estimates that are not yet realized; (b) applying a market-rate salary replacement for owner-operators who are underpaid; (c) discounting add-backs that are described as “one-time” but appear in multiple periods.
Layer 4: Pro Forma Run-Rate Adjustments (Evidence Required)
Pro forma items (annualizing revenue from a recently signed contract, or reflecting a full year of cost cuts from a completed restructuring) may be included, but only with supporting evidence and a demonstrated track record of execution. For the most complex pro forma adjustments, lenders expect not only robust supporting evidence but also a demonstrated history of successful execution of similar initiatives. Projected synergies that have no execution history are treated with significant skepticism.
Example: Analyzing a $10M Reported EBITDA Manufacturing Business
Reported EBITDA (GAAP): $10,000,000
+ Owner comp above market rate: + $350,000 [✓ Accepted, payroll records + comp survey]
+ One-time legal settlement (2023): + $275,000 [✓ Accepted, legal invoice, non-recurring]
+ Projected synergies (IT integration): + $500,000 [✗ Rejected, not yet initiated, no history]
+ Personal aircraft lease: + $120,000 [⚠ Partial, $60K accepted, $60K discretionary]
+ Run-rate revenue (new contract Q4): + $400,000 [✓ Accepted, signed contract, partial period]
Seller Adjusted EBITDA: $11,645,000
Lender-Underwritable EBITDA: $11,085,000
Effective haircut: ~$560,000 (~4.8% of seller’s figure)
On a $55M senior secured loan priced at 5.5x EBITDA, that $560,000 gap equates to roughly $3.1 million in incremental stated leverage, the difference between a 4.97x and a 5.50x debt-to-EBITDA ratio. In a covenant-governed structure, this distinction can mean the difference between compliance and technical default at origination.
Walking the Analysis: Key Metrics and Red Flags
The Three Critical Ratio Checks
Once Lender-Underwritable EBITDA is established, underwriters test three core metrics against the proposed debt structure:
- Total Leverage Ratio (Debt / EBITDA): The primary sizing metric in middle-market lending. Institutional lenders in the lower middle market typically underwrite to 3.0x–5.0x depending on sector, cycle, and structure. Anything above 5.5x at origination on a first-lien basis demands exceptional business quality justification.
- Debt Service Coverage Ratio (DSCR): (EBITDA − CapEx − Cash Taxes) / (Interest + Required Amortization). A DSCR below 1.10x on a trailing basis is a yellow flag; below 1.00x means the business cannot fund debt service from operations. DSCR feeds directly into covenant compliance and repayment capacity projections.
- Interest Coverage Ratio (ICR): EBITDA / Interest Expense. An ICR below 2.0x signals thin margin for rate increases or earnings volatility. With floating-rate structures dominating private credit, ICR compression from SOFR movement must be modeled across rate scenarios.
Stress Testing the EBITDA Floor
After establishing the base case, underwriters apply downside scenarios, typically a 15–25% EBITDA reduction, to stress leverage ratios against covenant triggers. A well-structured deal should survive a 20% EBITDA decline without breaching maintenance covenants, even accounting for the cushion built into covenant headroom. Lenders and analysts look for a clear, coherent narrative and scenario-tested cash flow models that are aligned with business reality. If the base case model relies entirely on continued EBITDA growth to remain in compliance, the credit structure is fragile.
The EBITDA-to-Free-Cash-Flow Bridge: The Most Overlooked Step
EBITDA is not cash. Underwriters must build the bridge: EBITDA minus cash interest, cash taxes, required capex maintenance, and working capital investment equals distributable free cash flow. If EBITDA is rising but operating cash flow is flat or declining (due to deteriorating receivables, inventory build, or deferred maintenance capex) the credit is deteriorating beneath the headline number. Reconciling EBITDA to actual cash flow is essential; a divergence is a sign that something is off in the underlying business model.
Industry Standards, Credit Data, and Red Flags Institutional Lenders Watch
What the Data Shows
Understanding the EBITDA normalization process in context requires grounding it in current credit performance data. The following data points, drawn from publicly available institutional research, define the stakes:
- Leveraged Loan Default Rate (Moody’s, July 2025): Projected to reach 7.5% by year-end 2025, rising to 7.9% in Q1 2026, nearly double the 3.4% historical average since 1996. Distressed exchanges accounted for 64% of all defaults in H1 2025, itself the highest annual share on record.
- Direct Lending Default Rate (KBRA DLD Index, Sept. 2025): Trailing 12-month default rate held at 1.8%, with KBRA forecasting the lower middle market rate could reach 3.0% by year-end, driven by a growing pipeline of stressed borrowers.
- Combined Leveraged Loan Default Rate (Pitchbook LCD, Aug. 2025): Including distressed liability management exercises (LMEs), the combined U.S. leveraged loan default rate stood at 4.37%, down from a recent high of 4.70% in December 2024, suggesting possible stabilization.
- First-Lien Recovery Rates (Moody’s Ultimate Recovery Database): Expected ultimate recoveries on U.S. first-lien loans have declined to approximately 68%, versus a long-run historical average in the high 70s. Structural forces, including loan-only capital structures with little junior debt beneath, are the primary driver of compression.
- Middle-Market Transaction Multiples (Pepperdine Private Capital Markets Report, 2024): Lower middle market transactions closed at 3x to 6x normalized EBITDA depending on industry and customer concentration: meaning a $200,000 normalization error directly translates to $600,000–$1.2 million in enterprise value exposure.
Common Red Flags Experienced Lenders Identify
- EBITDA Inflation Without Cash Confirmation: A large gap between reported/adjusted EBITDA and operating cash flow on the cash flow statement is the single most important red flag in any credit package.
- Recurring “One-Time” Charges: If restructuring, legal, or integration costs appear in the add-back schedule across three consecutive years, they are not one-time; they are operating costs. Buyers challenge EBITDA add-backs through quality of earnings (QoE) review, an independent accounting analysis that determines whether each adjustment is legitimate and genuinely non-recurring.
- Uncapped Pro Forma Synergies: Expansive add-backs can materially affect leverage outcomes. Institutional lenders impose caps, frequently expressed as a percentage of EBITDA, on projection-based or non-recurring adjustments, along with time-based restrictions. Uncapped synergy add-backs in a credit agreement are a structural weakness.
- The Covenant Headroom Illusion: Historically, appropriate covenant headroom was ~25%. Today, most deals carry headroom of 30%+, with 35%+ described as “cov-loose” and 40%+ common in large-cap documentation. Wide headroom combined with aggressive EBITDA definitions means maintenance covenants may offer limited protection before liquidity deteriorates.
- Customer Concentration Risk in the Revenue Quality: A quality of earnings review evaluates revenue recognition, customer concentration, revenue quality, gross margin trends, and the relationship between EBITDA and cash flow. A single customer representing more than 20% of revenue is a material credit risk that must be stress-tested separately.
Bond Capital’s EBITDA Normalization Underwriting Checklist
The following step-by-step framework should be completed on every middle-market credit before a term sheet is issued:
- Obtain Three Full Years of Audited Financials + LTM Period. Review the full income statement, balance sheet, cash flow statement, and footnotes. Do not work from management accounts alone.
- Build the GAAP-to-Reported-EBITDA Bridge. Start from net income. Add back interest, taxes, D&A. Verify each line ties to the audited statements.
- Request the Full Add-Back Schedule with Supporting Documentation. Each add-back must be accompanied by: vendor invoices or payroll records; board minutes or legal correspondence; and a written management explanation. Verbal justifications are insufficient.
- Apply Independent Lender Haircuts. Remove any synergy adjustments not yet initiated or without a documented execution history. Adjust owner compensation to market-rate replacement using comparable surveys. Discount any “one-time” item that appeared in more than one period.
- Reconcile Lender-Underwritable EBITDA to Operating Cash Flow. The EBITDA-to-OCF bridge must be explainable. Working capital movements, maintenance capex requirements, and cash tax rates must all be modeled.
- Stress Test at Minus 15% and Minus 25% EBITDA. Calculate leverage ratios, DSCR, and ICR under both scenarios. Test against proposed covenant levels. Confirm the business remains financeable at the downside case.
- Review Covenant EBITDA Definition in the Credit Agreement. Confirm that caps are placed on pro forma synergies and non-recurring add-backs. Validate that the EBITDA definition used in covenant calculations is consistent with the underwriting EBITDA used to size the loan.
- Commission or Review an Independent Quality of Earnings Report. For transactions above $5M EBITDA, a third-party QoE from a recognized accounting firm is standard institutional practice. The QoE examines revenue recognition, customer concentration, gross margin trends, add-back support, reserves, and working capital behavior.
- Document All Adjustments and Credit Committee Rationale. Maintain a written record of every accepted and rejected add-back, with the underwriting team’s stated rationale. This is essential for portfolio monitoring and covenant administration throughout the loan’s life.
Key Takeaways
- 🔑 Seller EBITDA is a hypothesis. The underwriter’s job is to arrive at a Lender-Underwritable EBITDA that reflects actual, recurring, evidence-supported earnings, not management’s most optimistic presentation. Seller-provided schedules are a starting point, not a conclusion.
- 🔑 The EBITDA-to-cash-flow bridge is non-negotiable. Rising EBITDA with flat or declining operating cash flow is one of the clearest early warning signals in credit analysis. Every underwriting model must reconcile EBITDA to distributable free cash flow.
- 🔑 Add-back caps protect lenders structurally. Expansive EBITDA definitions without caps on pro forma synergies and non-recurring items create structural leverage risk at origination. Institutional lenders impose percentage-of-EBITDA caps and time-based restrictions as standard practice.
- 🔑 Recovery rates are declining, first-lien is not bulletproof. With expected U.S. first-lien recoveries falling to approximately 68% (versus historical high-70s), lenders cannot rely on collateral as a safety net for aggressive underwriting. EBITDA quality matters more than ever for loss-given-default modeling.
- 🔑 Covenant headroom has widened beyond protective levels. With most private credit deals now carrying 30%+ headroom, and distressed exchanges accounting for 64% of all defaults in H1 2025, underwriters must internalize that maintenance covenants alone are insufficient, rigorous EBITDA normalization at origination is the primary risk control.


